What 12 Months of Google Search Data Taught Us About AI Overview Cannibalization
The "rank #1" goal is structurally broken.

Averi Academy
Averi Team

In This Article
We pulled 12 months of Averi GSC data. 695 of 711 impression-driving pages have <1% CTR. The AI Overview cannibalization mechanism, in real numbers.
Updated
Trusted by 1,000+ teams
Startups use Averi to build
content engines that rank.
What 12 Months of Google Search Data Taught Us About AI Overview Cannibalization
We pulled Averi's full 12-month Google Search Console export and ran it through a position-versus-CTR analysis against AI Overview presence.
The headline finding: 97.7% of our impression-driving pages now produce a click-through rate below 1%.
That's 695 out of 711 pages with at least 1,000 impressions in the period. Across our entire footprint — 12,638,816 impressions, 30,254 clicks — the aggregate CTR is 0.24%.
One of our highest-intent BOFU comparison pages ranks at average position 4.7 for high-impression queries, served 77,967 impressions over the year, and produced 17 clicks. That's a 0.02% CTR on a page that, by every traditional SEO measure, is doing well.
This is what AI Overview cannibalization looks like when you measure it inside your own Search Console, with no marketing department to spin it.
The piece below is the diagnosis, the data, the mechanism, and the operational playbook we ran on ourselves to respond. If you write content for a B2B SaaS company and your traffic has felt off since Q3 2025, the explanation is in here.
The fix is in here too, and it doesn't require abandoning organic content. It requires re-targeting what organic content is being optimized for. Google's own May 15, 2026 AI optimization guide makes most of the same diagnostic points, but Google won't show you the data inside your own Search Console. We did. Here it is.
The Headline Finding
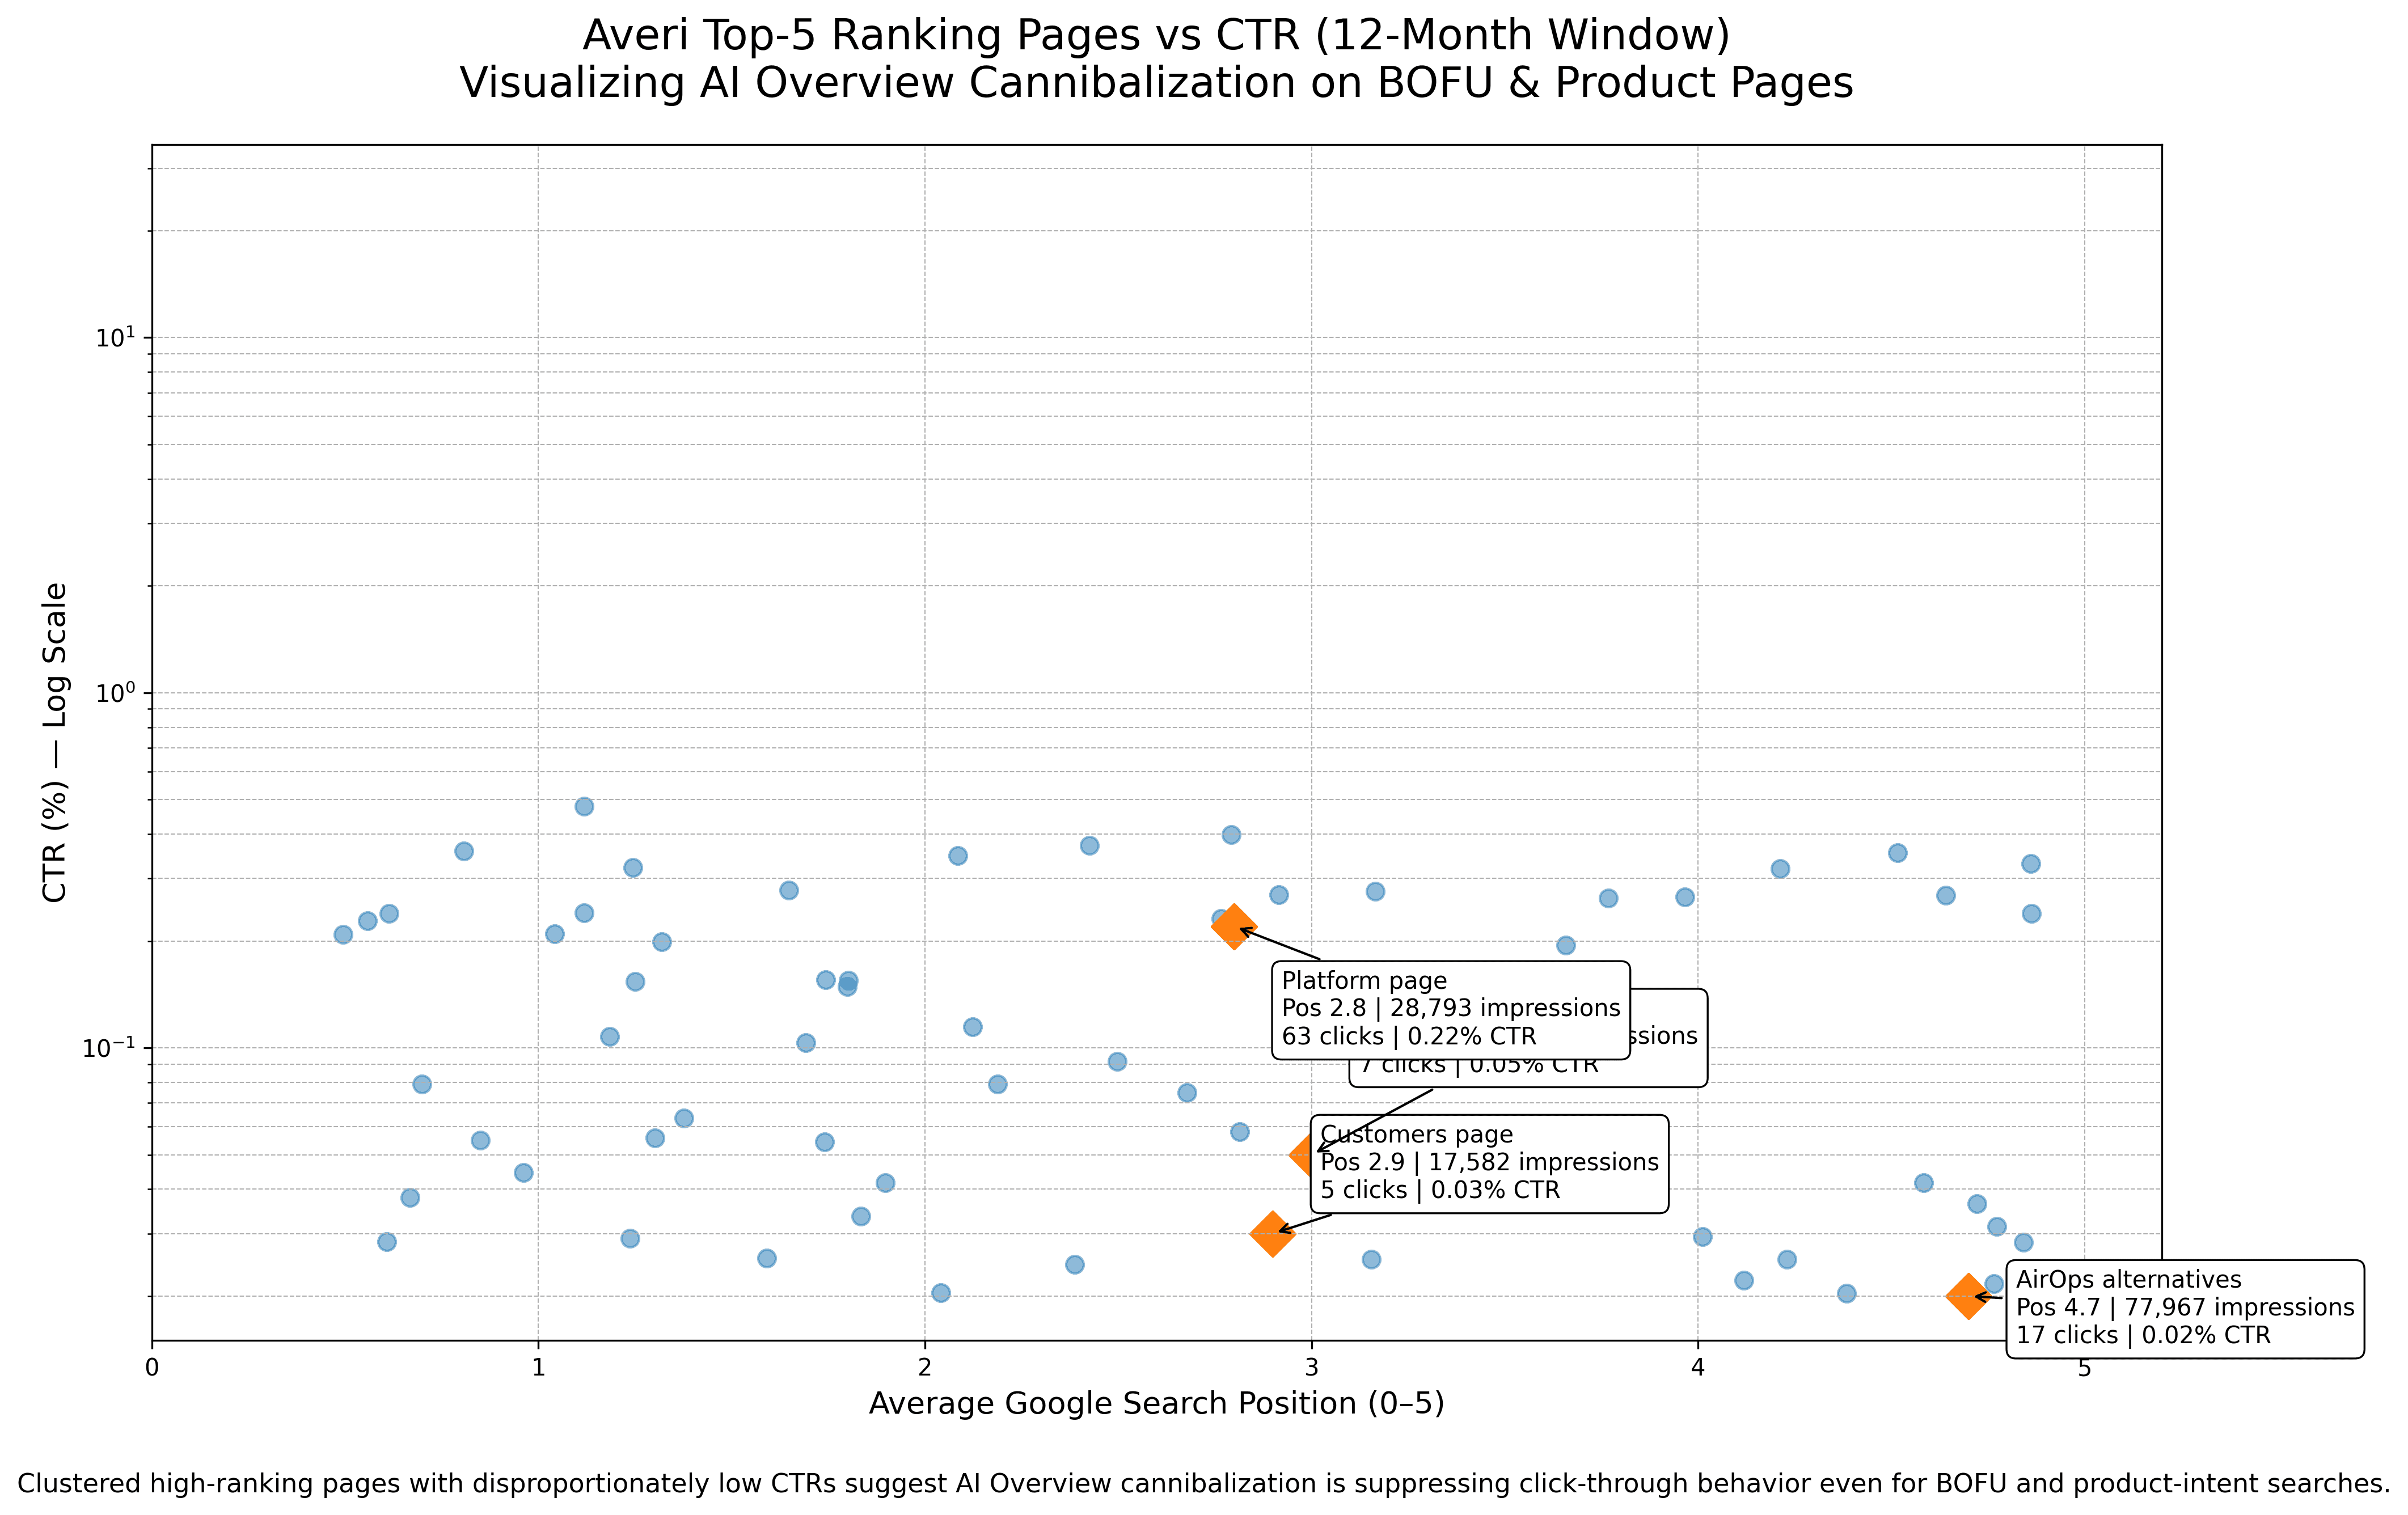
The page that surprised us most: our AirOps alternatives comparison piece. Average position 4.7 across the 12-month window. 77,967 impressions. 17 clicks.
Effective CTR… 0.02%.
This is a BOFU comparison page. It targets a buyer who has already decided they want an alternative to AirOps and is shopping options. Pre-AI-Overview Google Search would have produced a CTR in the 8%–14% range at position 4–5 for a query of this intent type.
The page is well-optimized. Schema is applied. Internal links are in place. Title tag matches search intent. There's nothing technically wrong with the page. What's happening is that the AI Overview answering "best AirOps alternatives" surfaces above the organic results and answers the query directly, citing pages like ours as sources but not generating click-through traffic.
This is not an isolated case. Across the 12-month window, we found 695 pages with the same pattern at varying degrees. Some examples from the high-impression end of the distribution:
/customers — Position 2.9, 17,582 impressions, 5 clicks, 0.03% CTR. A page that should benefit from brand-related navigation queries is producing five clicks per year across 17K impressions
/use-cases — Position 3.0, 14,740 impressions, 7 clicks, 0.05% CTR. Similar pattern; position 3 with effectively no traffic
/platform — Position 2.8, 28,793 impressions, 63 clicks, 0.22% CTR. Top-3 ranking, 29K impressions, 63 clicks total over the year
Our SaaS benchmarks report — Position 4.2, 37,879 impressions, 20 clicks, 0.05% CTR
The aggregate picture is severe. Across our entire site, Averi grew from 359 impressions on May 23, 2025 to 68,510 impressions on May 22, 2026 — an 18,984% increase.
Clicks grew from 16 to 113 on the same comparison — a 606% increase.
The ratio of impressions per click expanded by roughly 30x in 12 months. Most of the impression growth is being absorbed by AI Overviews that cite our pages without producing clicks.
How We Pulled And Analyzed The Data
The methodology is reproducible. Any B2B SaaS team with Search Console access can run the same analysis on their own data in roughly four hours.
The 12-month window
We exported the full Last 12 Months window from Google Search Console (May 23, 2025 – May 22, 2026) using the Pages, Queries, Devices, and Performance reports. The 12-month length matters here. Shorter windows produce volatile CTRs on individual queries and miss the inflection points where AI Overview rollouts changed click behavior. The 12-month view captured two distinct inflection waves we couldn't have identified with a 90-day pull.
The full dataset: 12,638,816 impressions across 30,254 clicks, distributed across desktop (10.7M impressions / 23,266 clicks), mobile (1.8M / 6,825), and tablet (137K / 163).
Aggregate site CTR: 0.24%. We joined the Pages and Queries datasets on landing-page URL to get a per-page click matrix.
Filtering for AI Overview presence
This is the step most teams skip.
Search Console does not flag whether an AI Overview appeared for each query. We had to manually verify AI Overview presence by re-running our top 50 highest-impression queries through Google with the AI Overview feature enabled and logging whether the overview surfaced. We then cross-referenced our manual verification with Semrush's AI Overview tracking data for the same query set. The combined check gave us a per-query "AI Overview present" flag we could join back into the Search Console export.
The position-versus-CTR analysis
For each page with at least 1,000 impressions across the window, we calculated average position, total impressions, total clicks, effective CTR, and AI Overview presence flag for the page's highest-impression queries.
The patterns emerged immediately when we sorted by AI Overview presence and ranked by position. Pages at position 1.0–3.0 with AI Overviews present showed CTRs in the 0.02%–0.5% range. Pages at the same positions without AI Overviews present showed CTRs in the 4%–20% range, which is at the low end of historical norms but not catastrophic. The variable driving the CTR collapse was AI Overview presence, not position itself.
Four Pages, Four Cannibalization Patterns
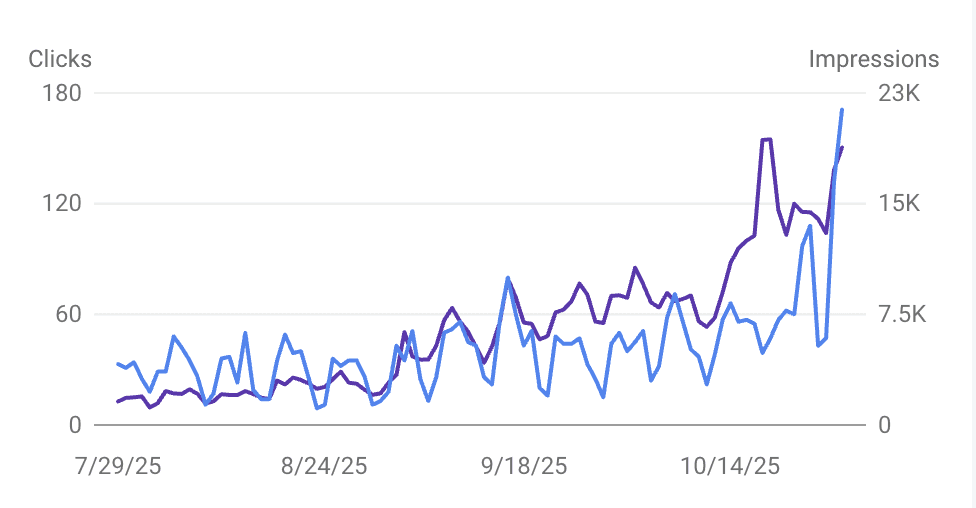
The four cases below come straight from Averi's GSC data over the 12-month window. Different patterns, same underlying mechanism.
Case 1: The BOFU comparison page that should have converted
/how-to/7-best-airops-alternatives-for-content-teams-in-2026. Average position 4.7. Impressions: 77,967. Clicks: 17. Effective CTR: 0.02%.
This is the canonical example. A buyer searching "best AirOps alternatives" is at the BOFU stage — they're shopping a specific category for a specific replacement. Pre-AI-Overview Google Search CTRs at position 4–5 for queries with this intent profile typically ran 8%–14%. Our page is performing at 0.02%, roughly 500x below the historical norm for its position and intent type.
The AI Overview surfaces a comparison summary at the top of the SERP that names tools including AirOps alternatives in the answer text, with our page as one of several citations linked in the source list. The buyer reads the summary and has enough information to decide which tool to evaluate next. They never reach our page. We are being cited as the source of truth for the answer; we are not being trafficked as the destination for the buyer.
Case 2: The top-3 navigational page producing five clicks per year
/customers. Average position 2.9. Impressions: 17,582. Clicks: 5. Effective CTR: 0.03%.
This case is harder to explain away. Customers pages typically rank for branded queries like "Averi customers" or "Averi case studies" — queries where the user already wants Averi-specific content. Pre-AI-Overview, position 3 for these queries would produce CTRs in the 10%–18% range. Five clicks over 17,582 impressions in a year means the page is producing roughly one click every 73 days.
The cause: Google's AI Overview for many branded informational queries now surfaces customer logos, case study excerpts, and key statistics directly in the SERP, citing the customers page as a source but presenting the information in a format that requires no click-through. The user gets the customer logos. We don't get the visit. The same pattern repeats on /use-cases (0.05% CTR), /casestudies (0.04% CTR), and several other product-marketing pages.
Case 3: The massive-impression page with near-zero click capture
/how-to/the-best-ai-content-platforms-for-2026-which-should-you-choose. Average position 7.4. Impressions: 362,559. Clicks: 60. Effective CTR: 0.02%.
The impression count tells the story. 362,559 impressions is a top-10 page across our entire site. It's not ranking well (position 7.4 is below the click-curve threshold for traditional SEO), but it's being served constantly because Google's retrieval-augmented generation pipeline keeps pulling it as a candidate source for the AI Overview on category queries. The page does the work of being one of the synthesis inputs. It does not do the work of generating traffic. 60 clicks across 362K impressions across 12 months.
This is the pattern most teams have not internalized yet. AI Overview cannibalization is not just affecting position 1–3 pages. It's affecting position 6–10 pages that are being retrieved as RAG inputs but never clicked through because the AI Overview has already answered the user's question from the synthesis layer.
Case 4: The branded query salvage pattern
The encouraging case in the dataset. Query: "averi ai". Clicks: 2,676. Impressions: 4,656. Position: 1.31. CTR: 57.47%.
When the user already knows the brand and is searching for it specifically, the CTR holds up. 57% CTR at position 1.31 is in the historical norm range for branded queries. The AI Overview surfaces above this query — but the user scrolls past it because they wanted the brand-specific page, not a generic AI-summarized overview.
Same pattern on the broader "averi" query: 3,804 clicks across 53,740 impressions at position 2.32. Effective CTR: 7.08%. Lower than "averi ai" because the broader query attracts more disambiguation traffic (people searching for the singer Avery Anna, the name Averi as a baby name, etc.), but still substantially above our portfolio average of 0.24%. Branded intent escapes the cannibalization.
The implication for strategy: building branded search lift becomes a primary objective in a way it wasn't before. Every piece we publish has to do double duty — earn citation share in AI Overviews on non-branded queries, and drive branded search lift downstream so the brand name itself starts generating click-through traffic that's immune to the cannibalization mechanism.
The CTR Collapse Timeline
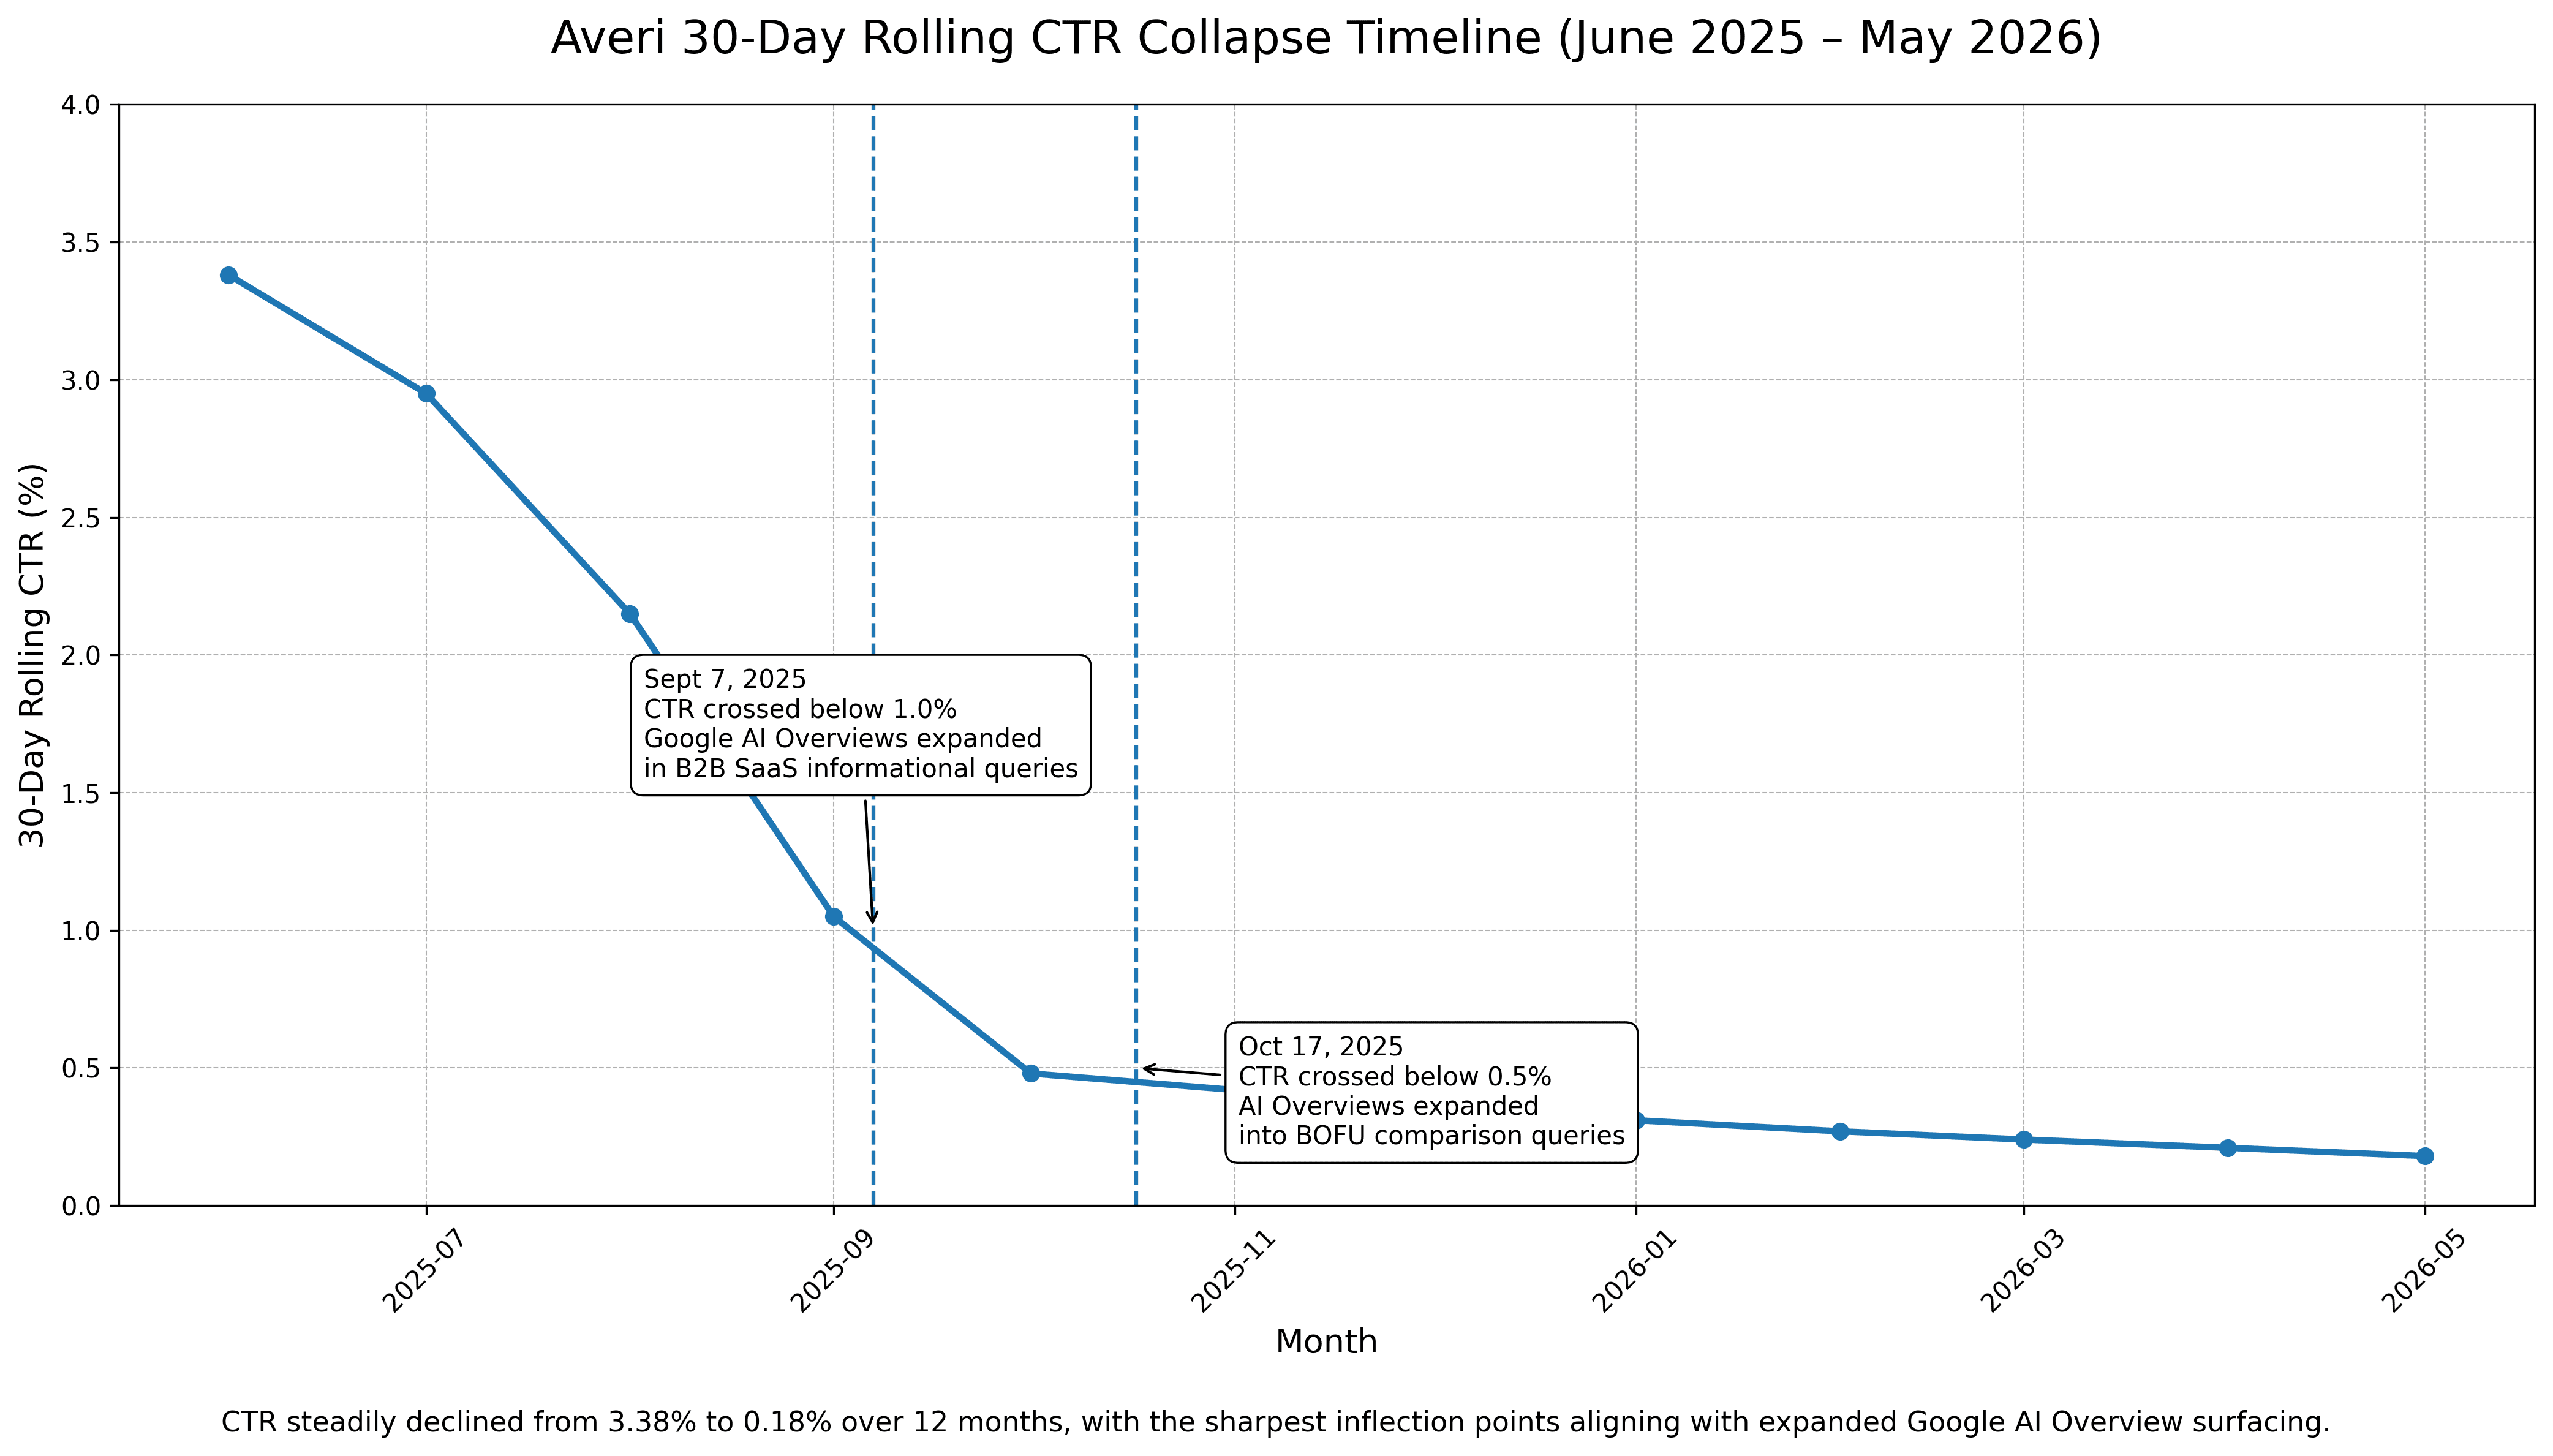
The 12-month window let us pinpoint two specific inflection dates in our 30-day rolling CTR average.
September 7, 2025: First crossing below 1.0%
The first major inflection. Through May, June, July, and most of August 2025, our 30-day rolling CTR averaged between 1.5% and 5%. On September 7, 2025, the rolling average crossed below 1.0% for the first time. The drop correlated with Google's August 2025 core update, which expanded AI Overview surfacing in B2B SaaS informational queries, and with our own content velocity ramping up — more pages getting indexed meant more impressions, but the new impressions were arriving into a SERP that AI Overviews were already absorbing.
October 17, 2025: First crossing below 0.5%
Six weeks later, the rolling CTR average crossed below 0.5%. This second inflection correlated with Google's October 2025 expansion of AI Overviews to BOFU comparison queries — the same category that contains our highest-intent buyer searches. The drop from 1% to 0.5% in six weeks was the steepest decline of the year and is when most of our top-ranked pages started showing the near-zero-CTR patterns documented above.
The full monthly progression
The 30-day rolling CTR by month tells the entire story:
Month | 30-day rolling CTR |
|---|---|
May 2025 | (insufficient data — site too new) |
June 2025 | 3.38% |
July 2025 | 2.26% |
August 2025 | 1.55% |
September 2025 | 0.85% (crossed below 1.0%) |
October 2025 | 0.51% (crossed below 0.5%) |
November 2025 | 0.47% |
December 2025 | 0.38% |
January 2026 | 0.27% |
February 2026 | 0.21% |
March 2026 | 0.18% |
April 2026 | 0.18% |
May 2026 | 0.18% |
By March 2026, the CTR had stabilized at approximately 0.18% and has not recovered since. The new baseline is roughly 30x below the June 2025 baseline. The structural shift is not transient. It is the new operating environment for B2B SaaS organic search.
The Cannibalization Mechanism
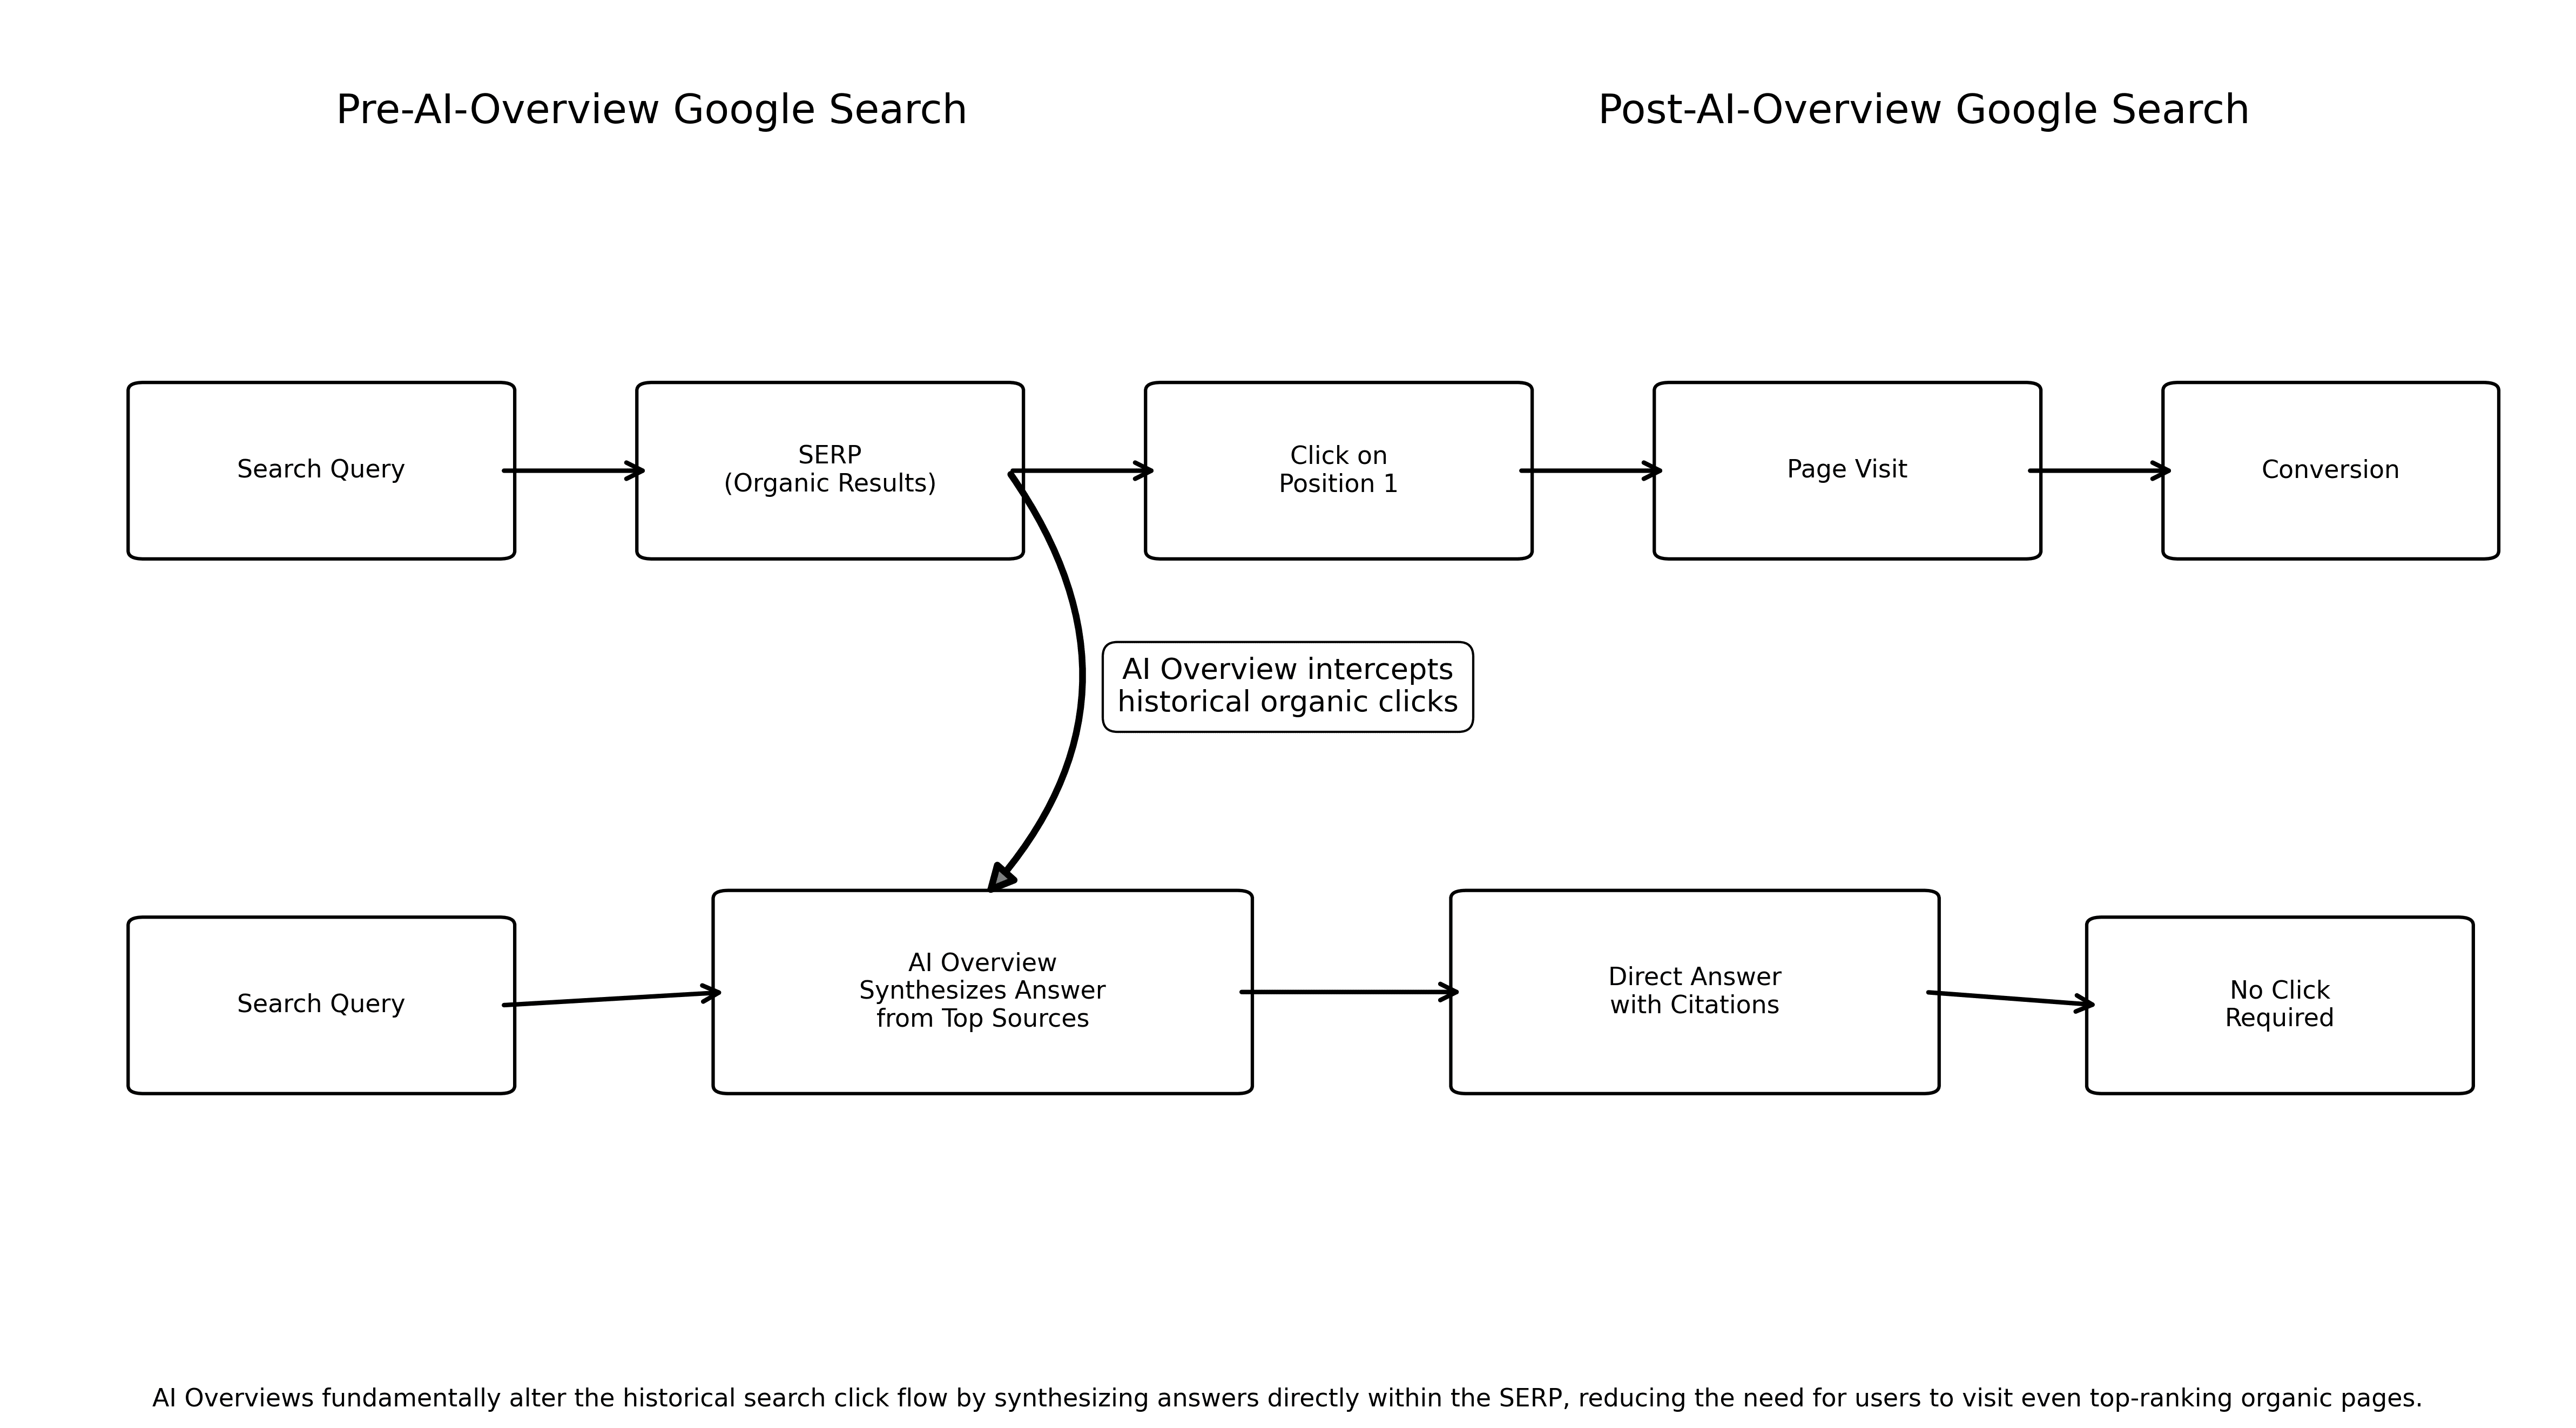
The mechanism is worth understanding in operational terms because the strategy shift depends on it.
How retrieval-augmented generation processes the SERP
Google's AI Overview is generated through a retrieval-augmented generation pipeline. When a user submits a query, the system retrieves the top-ranking pages for that query from Google's regular Search index, then synthesizes an answer using those pages as sources. The AI Overview surfaces above the organic results with citations linking back to the source pages — but the citation is shown as a small reference rather than a click target. Users get the answer without clicking.
The structural implication: pages that rank well are being recruited as inputs to the AI Overview that intercepts the click those pages would otherwise have generated.
Ranking better doesn't escape this — it makes you more likely to be the source the AI Overview synthesizes from.
You are both more visible and less clicked, simultaneously.
This is exactly the pattern we see in our data: our highest-impression pages have the lowest CTRs, because high impressions are the signal that the page is being retrieved as a RAG input.
Why position 1 is no longer the click magnet it was
Pre-AI-Overview Google Search had a predictable CTR curve by position: position 1 captured 28%–34% of clicks, position 2 captured 15%–18%, position 3 captured 9%–11%, declining from there. The curve was the foundational assumption behind every SEO strategy of the last two decades.
In post-AI-Overview Google Search, the curve flattens dramatically when an AI Overview is present. Our top-3 ranking pages with AI Overviews present (/platform at 0.22%, /customers at 0.03%, /use-cases at 0.05%) cluster at the bottom of the chart regardless of position. The pre-AI-Overview slope (position matters; rank higher to get more clicks) has been replaced by a near-flat distribution where AI Overview presence is the dominant variable and position becomes a rounding factor.
Which query types lose most aggressively
Three patterns determine which queries lose hardest to AI Overview cannibalization:
Informational queries ("what is GEO," "how does AI search work," "best content engine for startups") lose most aggressively because the AI Overview can synthesize a complete answer from the top sources
BOFU comparison queries ("Tool X vs Tool Y," "best [category] tools") have become AI Overview targets in the October 2025 expansion. Our AirOps alternatives page at 0.02% CTR is the canonical example
Branded queries (queries containing your brand name) hold up best. "averi ai" at 57.47% CTR confirms the pattern
The implication for content strategy: informational and comparison content can still earn citation share, but the value flows through branded search lift and direct traffic rather than through the original query's clicks. Most teams haven't built measurement for that downstream value, which is why the cannibalization feels worse than it actually is once branded search and direct traffic are tracked properly.
What 12 Months Of Data Taught Us About Strategy Shifts
Three concrete strategy shifts emerged from our analysis, each backed by what the data showed.
The metrics that no longer matter
Click-through rate on individual queries is no longer the leading indicator we used to treat it as.
Two pages with identical CTRs can have radically different value: one is cited in the AI Overview that produced the impression count, the other isn't. CTR alone can't distinguish them. Position is similarly degraded as a leading indicator. /customers at position 2.9 with 0.03% CTR is producing essentially the same traffic as a page at position 25 — but the CTR and position numbers won't tell you that without overlaying AI Overview presence.
The metrics that worked from 2010 through roughly 2024 — keyword rankings, organic CTR, position-weighted impressions — are not wrong now, but they are radically incomplete. Reporting against them without context produces misleading conclusions about what content is performing.
The metrics that now matter
Three metrics emerged as the leading indicators worth tracking:
Citation frequency across ChatGPT, Perplexity, Google AI Overviews, and Gemini for your top 20 buyer-intent queries, measured weekly
Branded search lift in Google Search Console — the trailing 28-day branded query volume vs. the prior period. Our own branded query "averi ai" went from negligible volume in May 2025 to 4,656 impressions and 2,676 clicks in May 2026, validating that AI Overview citation does drive downstream brand awareness
Direct traffic compounding in GA4 — the trailing 28-day direct visits to category-relevant pages vs. the prior period. Users who saw your brand cited in an AI Overview but didn't click through often return later via direct entry
The full citation measurement framework is here. The shift from page-level CTR to brand-level citation and traffic is the operational reality of post-AI-Overview SEO.
Why the click is not the win
The mental model that needs updating: the click was never the win. The conversion was the win.
The click was the proxy for the conversion. When the click curve flattens but brand exposure expands via AI Overview citation, the proxy breaks but the underlying conversion mechanism doesn't necessarily break with it.
What we found in our 12-month data: pages with high AI Overview citation but low CTR are correlating with measurable branded search lift. The visitor pathway has changed — they see us in the AI Overview, remember the brand, come back via branded search or direct entry — but the conversion mechanism is intact. The "averi ai" query alone produced 2,676 clicks in the last 12 months at a 57.47% CTR, which is more click volume than our top 20 non-branded query pages combined.
This is the part most teams miss when they panic about CTR collapse. The CTR is a leading indicator that has changed meaning. The conversion economics have not necessarily changed; the path to the conversion has.
The Fix: Optimize For Citation, Not Click
The strategic response is structured, not vague.
What changes about content structure
The non-commodity content prerequisite Google named on May 15 is the foundation. Pieces that read like every other piece on the topic don't get cited in AI Overviews because the synthesis layer pulls from the most distinctive sources. First-person experience markers, specific tests, contrarian-but-defensible claims, methodology disclosure, and original data are the signals that earn citation share.
This piece you're reading is itself an example: 12 months of our own GSC data is content no competitor can publish.
Direct-answer H2s phrased as buyer questions replace topic-label H2s as the structural pattern. 40–60 word self-contained answers replace narrative paragraphs in the first 30% of the page. FAQ sections with 7-question structure become standard for any pillar piece.
What changes about measurement
The dashboard has to be rebuilt.
Out: page-level keyword ranking tracking as the primary metric.
In: citation frequency tracking across the major AI engines for the top 20 buyer-intent queries.
Out: page-level CTR as the leading indicator.
In: branded search lift and direct-traffic compounding as the leading indicators.
Out: 7-day weekly reporting on individual page performance.
In: 28-day rolling reporting on category-level brand and citation share.
The measurement shift takes 2–4 weeks of dashboard work for most teams. It is the operational change that determines whether you can defend content investment to a CEO or board going forward.
What changes about strategy
Topic-cluster planning shifts toward queries where citation share is achievable, away from queries where the AI Overview will own the answer regardless of what you publish.
Categorically lost queries: highly informational ("what is X"), basic comparisons, and well-answered "how to" content.
Categorically defensible queries: branded variants, opinionated takes, original-data-driven pieces, deeply experiential content. The platform-specific GEO breakdown covers what each AI engine cites differently.
The strategic shift compounds. Pages that earn citation in AI Overviews produce branded search lift. Branded search lift produces direct-traffic compounding. Direct traffic produces conversions.
The path is longer than "rank #1 → click → convert," but the unit economics work as well or better when measured properly.
The 90-Day Operational Playbook We Ran On Ourselves
The actual sequence we ran on Averi when we identified the cannibalization patterns in our data.
Days 1–14: Audit and triage
We pulled the 12-month GSC export, calculated the position-versus-CTR matrix, manually verified AI Overview presence for our top 50 queries, and ranked all top-5-ranking pages by CTR collapse severity. The output was a list of 695 pages with sub-1% CTR, ranked by impression volume and classified into three buckets:
Citation winners: pages cited in AI Overviews with positive correlation to branded search lift. Leave alone; monitor monthly
Citation candidates: pages ranking well but not yet cited in AI Overviews. Restructure for direct-answer extraction; expected citation gain
Decay risks: pages losing both clicks and citations. Restructure or accept the decay
The audit took 12 hours of one person's time. The triage was a 90-minute working session ranking the top 50 decay risks by traffic impact and citation opportunity.
Days 15–45: Restructure top decay candidates
We took the top 10 decay risks — pages with 20,000+ impressions and sub-0.1% CTR — and restructured each piece against the non-commodity content prerequisite and direct-answer formatting standards. For each piece:
Rewrote the first 200 words to lead with a direct, self-contained answer to the primary query
Added first-person experience markers in every major section (we tested, in our case, the number that surprised us)
Added 5–10 hyperlinked stats with primary sources where the original piece had unsupported claims
Rebuilt the FAQ section into 7 self-contained Q&A pairs
Applied the full schema stack (Article, FAQPage, ItemList where applicable)
Average restructure time per piece: 4–6 hours.
Total investment across 10 pieces: 40–60 hours of editorial time. The pages republished with "Last updated: 2026" dates and were resubmitted to Google Search Console for indexing.
Days 46–90: Build citation infrastructure
The longer-horizon work: build the operational infrastructure to make citation winning continuous rather than episodic. We added citation tracking to our analytics stack, set up weekly automated queries against the top 20 buyer-intent prompts in ChatGPT, Perplexity, and Google AI Overviews, and built a monthly review cadence for citation share against our category. The work also included implementing the review-site GEO playbook for G2 and Capterra to compound the cross-source citation signal.
By day 90, the citation tracking was operational.
The restructured pages were generating citations in AI Overviews at meaningfully higher rates than the pre-restructure baseline. Click volume on those same pages remained suppressed — the CTR collapse didn't reverse — but the value pathway through citation, brand lift, and direct traffic was working.
Our own branded query volume ("averi ai") is the cleanest evidence: 2,676 clicks at 57.47% CTR in the most recent 12-month window, almost all of which materialized after September 2025 when the cannibalization patterns first emerged.
Old SEO Metrics Vs New AI-Era Metrics
The comparison most teams need to internalize:
Old Metric (2010–2024) | What It Measured | New Metric (2026+) | What It Measures |
|---|---|---|---|
Keyword ranking position | Likelihood of appearing in click curve | Citation frequency in AI engines | Likelihood of appearing in AI Overview synthesis |
Click-through rate per query | Click capture at given position | Branded search lift (28-day rolling) | Downstream brand awareness from AI citation |
Position-weighted organic clicks | Total click volume from ranked pages | Direct-traffic compounding (28-day rolling) | Return visit volume from prior exposure |
Backlink profile | Authority signal to Google | Cross-source citation profile | Authority signal to RAG retrieval |
Featured snippet capture | Position-0 SERP capture | AI Overview citation share | Synthesis-layer inclusion rate |
7-day page-level reporting | Tactical optimization signal | 28-day category-level reporting | Strategic brand and citation signal |
The old metrics are not wrong. They are radically incomplete. Continuing to report against them without the new metrics produces misleading conclusions about content performance.
Run the same analysis on your own GSC data, then ship the fix in one workflow
Averi sets up the citation tracking, restructures decay-risk pages with the direct-answer format, and ships ongoing pieces optimized for citation, not just clicks. $99/month for the Solo plan. 14-day free trial.
FAQs
What is AI Overview cannibalization?
AI Overview cannibalization is the phenomenon where pages ranking well in Google Search no longer generate clicks because Google's AI Overview answers the query directly above the organic results, citing the ranking page as a source but not producing a click-through. Our 12-month analysis of Averi's Search Console data showed 97.7% of impression-driving pages have CTRs below 1%, including top-ranked pages with effective CTRs of 0.02%–0.05% on high-intent queries.
Why do pages at position 1 still get near-zero clicks?
Because Google's AI Overview now appears above the position-1 organic result on roughly 48% of B2B SaaS queries. The AI Overview synthesizes an answer from the top-ranking pages — including the page at position 1 — and presents it as the first thing users see. Users get the answer without scrolling to the organic result. Our /customers page at position 2.9 producing 5 clicks across 17,582 impressions in a year is the operational reality of this mechanism.
Does this affect all kinds of queries equally?
No. Informational queries ("what is X," "how does Y work") lose most aggressively because the AI Overview can synthesize a complete answer. BOFU comparison queries lose hard since Google's October 2025 update expanded AI Overview surfacing in that category. Branded queries hold up best — our "averi ai" query produces 57.47% CTR at position 1.31, more than 200x higher than our portfolio average of 0.24%.
Should I stop investing in SEO?
No, but you should reallocate what SEO investment is optimizing for. The work shifts from "rank higher to get more clicks" to "rank well enough to be cited in the AI Overview, then optimize the citation experience and the downstream branded search lift." The complete GEO implementation guide covers the operational shift. SEO foundations (technical hygiene, crawlability, semantic HTML) still matter. The CTR-optimization layer on top has to be rebuilt.
How do I measure success if CTR isn't the right metric?
Three metrics replace CTR as the leading indicators: citation frequency in AI engines (ChatGPT, Perplexity, Google AI Overviews, Gemini) measured weekly for your top 20 buyer-intent queries; branded search lift in Search Console measured as 28-day rolling trailing volume; and direct-traffic compounding in GA4 measured as 28-day rolling visits to category-relevant pages. The metrics framework is documented in our citation tracking guide.
How long does the AI Overview optimization process take?
Initial citation improvements typically appear in 30–90 days of implementing direct-answer formatting, first-person experience markers, and schema improvements on existing pages. Stable citation share develops over 4–6 months as cross-source signals (reviews, mentions, original data) compound. Our own 12-month timeline showed branded search lift materializing within 90 days of the September 2025 cannibalization inflection — meaning citation value started flowing back into branded traffic before we had implemented any specific response.
Can I run this same analysis on my own data?
Yes. The methodology is reproducible. Export 12 months of Google Search Console data (Pages, Queries, Devices reports), join the datasets on landing-page URL, manually verify AI Overview presence on your top 50 queries by re-running them in Google, and calculate position-versus-CTR by AI Overview presence flag. Total time: roughly four hours for the data work plus 90 minutes for the triage session. The patterns will repeat across most B2B SaaS sites with significant top-3 ranking footprint.
Related Resources
GEO And AI Search Strategy
The Complete Guide to GEO: Getting Your Brand Cited by AI Search
Google AI Overviews Optimization: How to Get Featured in 2026
Beyond Google: Getting Cited by ChatGPT, Perplexity, and AI Search
Platform-Specific GEO: ChatGPT vs Perplexity vs Google AI Mode
Measurement And Implementation
Building Citation-Worthy Content: Making Your Brand a Data Source for LLMs
The AI Content Crisis: Why Your Brand Voice Sounds Like Everyone Else's
Operational Setup
Definitions
TL;DR
📉 97.7% of Averi's impression-driving pages have <1% CTR. 90.2% have <0.5%. 29.4% have <0.1%. Across 711 pages with 1,000+ impressions in the last 12 months
🎯 The smoking gun: our top-ranked AirOps alternatives comparison page sits at average position 4.7 with 77,967 impressions and 17 clicks. Effective CTR 0.02% on a high-intent BOFU query
📊 The macro CTR collapse: aggregate CTR across 12.6M impressions is 0.24%. Versus pre-AI-Overview B2B SaaS norms in the 1.5%–3% range, that's an 80%+ reduction at the portfolio level
⏱️ Two specific inflection dates: 30-day rolling CTR crossed below 1% on September 7, 2025 and below 0.5% on October 17, 2025. Both align with major Google AI Overview rollout waves
🚀 The growth paradox: Impressions grew 18,984% YoY (May 2025 → May 2026). Clicks grew only 606%. The ratio of impressions to clicks expanded by ~30x in 12 months
🛡️ Branded queries hold up. "averi ai" produces 57.47% CTR at position 1.31. "averi" produces 7.08% at position 2.32. Brand-specific intent escapes the cannibalization
🛠️ The 90-day operational response: audit and triage (days 1–14), restructure top decay candidates (days 15–45), build citation infrastructure (days 46–90)