How to Conduct Performance Benchmarking for Ecommerce Brands

Averi Academy
Averi Team
8 minutes

In This Article
Turn store data into clear growth plans by benchmarking conversion, AOV, and CAC against competitors and industry norms.
Updated:
Trusted by 1,000+ teams
Startups use Averi to build
content engines that rank.
Performance benchmarking helps ecommerce brands measure key metrics like conversion rates, average order value (AOV), and customer acquisition cost (CAC) against industry standards, competitors, or past performance. It identifies gaps, highlights areas for improvement, and enables smarter business decisions. For instance, if your conversion rate is 2% but the industry average is 3.5%, you know there's room to improve. Here's a quick guide to get started:
Track Key Metrics: Focus on AOV, CAC, conversion rates, and customer lifetime value (CLV).
Collect Internal Data: Use tools like Shopify Analytics, Google Analytics 4 (GA4), or CRM systems to establish your baseline.
Compare to Benchmarks: Evaluate your performance against competitors and industry averages using tools like SimilarWeb or Shopify Benchmarks.
Set Goals: Use SMART goals to address gaps, such as improving mobile conversion rates or reducing cart abandonment.
Leverage AI Tools: Automate data analysis and competitor tracking with platforms like Panoramata or Querio.
Benchmarking for E-commerce Success: Key Metrics Every Store Owner Should Track
Step 1: Choose Which Metrics to Track
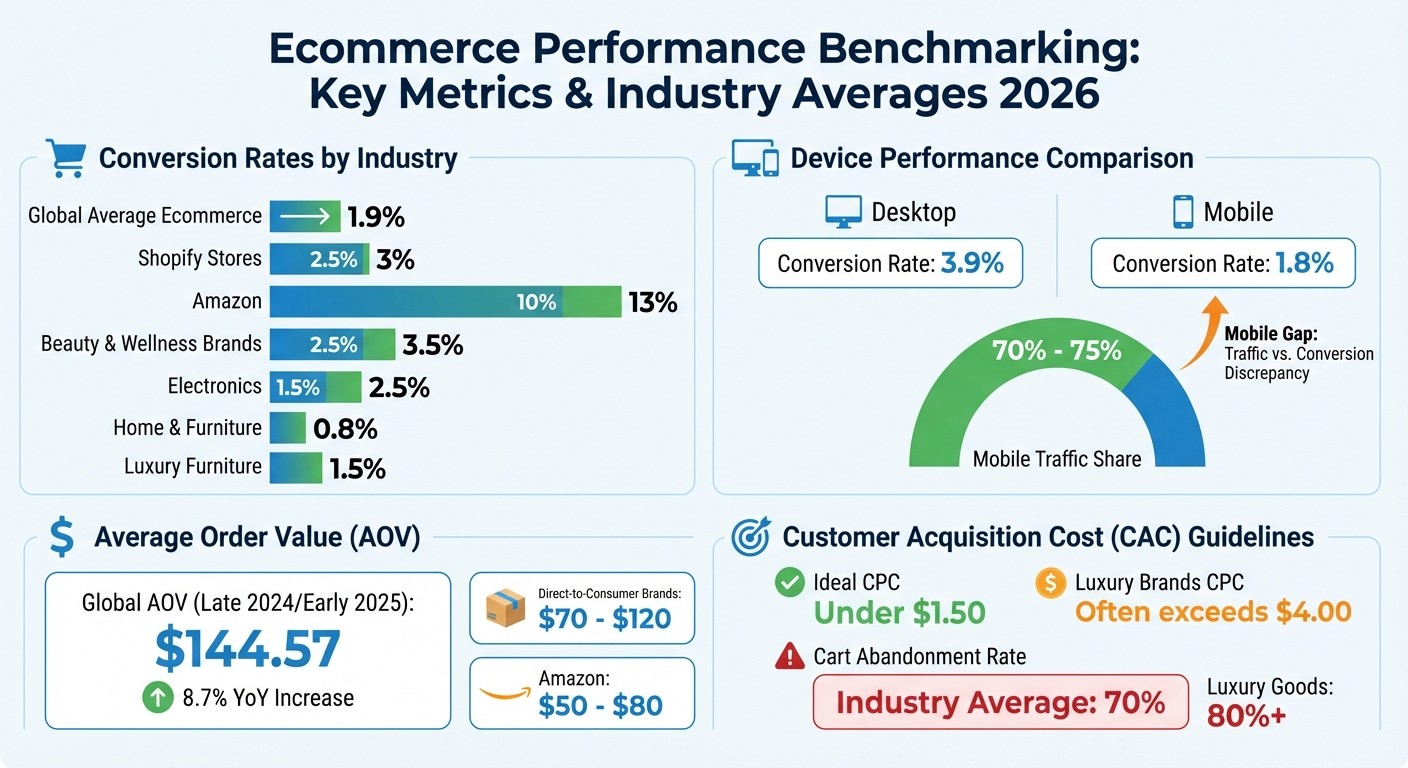
Ecommerce Performance Benchmarking: Key Metrics & Industry Averages 2026
To measure success effectively, pick metrics that align with your business objectives. For example, if you're aiming for rapid growth, focus on metrics like conversion rate, customer acquisition cost (CAC), and traffic volume. On the other hand, if profitability is your goal, prioritize customer lifetime value (CLV), return on ad spend (ROAS), and repeat purchases.
Your specific business model will determine which metrics matter most. For instance, high-ticket brands like luxury furniture sellers often see lower conversion rates (typically 0.8% to 1.5%) but depend on high average order values (AOV) to remain profitable. Conversely, beauty and wellness brands usually enjoy higher conversion rates (around 2.5% to 3.5%) and benefit from frequent repeat purchases.
Using the SMART framework - Specific, Measurable, Achievable, Relevant, and Time-bound - can help you focus on actionable metrics instead of vanity numbers. Below is a closer look at some of the key metrics to help you benchmark effectively.
Conversion Rates
Conversion rate (CVR) is calculated as (Conversions ÷ Visitors) × 100 [1]. It’s a strong indicator of whether your site experience, product offerings, and pricing work together effectively.
As of early 2026, the global average ecommerce conversion rate is about 1.9%. Shopify stores typically achieve rates between 2.5% and 3%, while Amazon leads the pack with conversion rates between 10% and 13%, largely due to the "Prime Effect" [3]. Rates vary significantly by industry: beauty and wellness brands average 2.5% to 3.5%, electronics fall between 1.5% and 2.5%, and home and furniture brands hover around 0.8% to 1.5% [3].
Device performance also plays a role. Desktop conversion rates average 3.9%, while mobile rates are closer to 1.8%, even though mobile generates 70% to 75% of all traffic [3]. If your mobile conversion rates dip below 1.8%, consider optimizing the checkout process with one-click payment options like Apple Pay or Google Pay.
Customer Acquisition Cost (CAC)
Customer acquisition cost measures how much you spend to acquire a new customer, calculated as Total Marketing Spend ÷ Number of New Customers [2].
With rising acquisition costs - evidenced by climbing cost-per-click (CPC) rates - many businesses are pivoting from paid ads to organic search and retention strategies like loyalty programs [3]. For context, an ideal CPC is under $1.50, though luxury brands often exceed $4.00. Keep in mind, if your CAC surpasses your customer lifetime value, you’re losing money on every new customer [1].
Average Order Value (AOV)
Average order value reflects the average amount spent per transaction. It’s calculated as Revenue ÷ Number of Orders [1] and is a key driver of profitability.
By late 2024/early 2025, the global AOV reached approximately $144.57, an 8.7% increase year-over-year [3]. Direct-to-consumer brands typically report AOVs between $70 and $120, while platforms like Amazon average between $50 and $80 [1]. To boost AOV, explore tactics like product bundling, cross-selling during checkout, or offering "buy now, pay later" options.
Choosing the right metrics is the foundation for effective benchmarking and informed, data-driven decisions in the next steps.
Step 2: Gather and Review Your Internal Data
Once you've chosen your key metrics, the next step is to build a baseline by collecting historical performance data. This baseline helps you understand where you stand today and allows you to track trends over time.
Start with your ecommerce platform. Platforms like Shopify offer built-in analytics tools, such as reports on "Online store conversion over time" and "Customer Cohort Analysis." These reports provide insights into conversion rates, average order value, retention rates, and fulfillment times [6]. If you're using BigCommerce or another platform, look for similar features that automatically compile sales and customer data. This foundational data is essential for diving deeper into analytics and CRM insights.
Next, leverage Google Analytics 4 (GA4) to analyze website performance, traffic sources, and user behavior. You can access these reports via the Admin panel under Account Settings, where you can also benchmark your metrics against industry standards. To gain even more detailed customer insights, tap into your CRM or email marketing system, such as Klaviyo [1][5].
For larger operations, centralizing your data is key. Use data warehouses like Snowflake, BigQuery, or Redshift to consolidate marketing, finance, and inventory data. This approach creates a "single source of truth", eliminating discrepancies between departmental reports [1]. In one case, a subscription box company saw a 10% improvement in retention by integrating AI with their data warehouse [1].
When analyzing historical trends, keep seasonality in mind. Metrics often surge by 30%-50% during peak periods like Black Friday or Cyber Monday [1]. Additionally, ensure your team is aligned on KPI definitions. For instance, if Marketing and Finance calculate "Customer Lifetime Value" differently, the resulting benchmarks will be inconsistent. Implementing strong data governance can enhance data quality by up to 30% and cut reconciliation time in half [1].
Step 3: Compare Your Performance to Benchmarks
After organizing your internal data, the next step is to measure it against benchmarks. This means looking at your historical performance, evaluating competitors, and considering industry standards. Each comparison offers unique insights into where you excel and where improvements are needed.
Compare Against Competitors
Start by selecting 3-5 direct competitors who share your business model, audience, and product focus. Tools like SimilarWeb can help you analyze their website traffic sources - whether from organic search, paid ads, or social media. You can also gain insights into their audience demographics and keyword performance [4]. For a more automated approach, platforms like Panoramata track competitor newsletters, SMS campaigns, ads, and landing pages, potentially saving you about $760 per month [4]. As Panoramata highlights:
Performance metrics must be viewed in relation to competitors' data [7].
If you’re using Shopify, Shopify Benchmarks offers a tailored comparison of your store against similar merchants. It evaluates metrics like order volume, primary market, and product categories, showing how you rank - whether in the 25th percentile, median, or 75th percentile [6]. This helps pinpoint specific areas for growth.
Use Industry Averages
Once you’ve analyzed competitor performance, zoom out to see how you stack up against industry-wide benchmarks. These averages provide a broader context, helping you understand if you’re meeting general market expectations. For example, the global ecommerce conversion rate in early 2026 is about 1.9%, though it varies by category: beauty and wellness brands often achieve 2.5%-3.5%, while home and furniture stores typically range between 0.8%-1.5%, reflecting higher order values and longer decision-making processes [3].
To access industry benchmarks, enable benchmarking in Google Analytics 4 by going to Admin > Account Settings and turning on "Benchmarking" and "Modeling contributions and business insights." This feature allows you to compare your site’s performance against anonymous aggregates [4]. Keep in mind, cart abandonment rates hover around 70% across industries, but luxury goods often exceed 80% [1]. Additionally, the global average order value reached $144.57 in late 2024/early 2025, marking an 8.7% increase year-over-year [3].
Build Visual Comparisons
To make these insights actionable, create simple tables or charts that place your metrics alongside competitor and industry benchmarks. For example, if your conversion rate is 2.1% but the industry average for your category is 2.8%, that gap signals a clear opportunity for improvement.
Tools like Querio can simplify this process by generating visual charts from your data [1]. You can ask questions like, “How does last month’s cart abandonment rate compare to industry standards?” and get instant visual answers. Mohamad Ali Baydoun, CTO at LemonadeFashion, emphasizes:
It's not just about saving time and money, it's about making data accessible [1].
Focus on percentile benchmarking to evaluate your progress. For instance, if your average order value is in the 25th percentile, you know there’s room to grow toward the median or 75th percentile [6]. These visual comparisons make performance gaps impossible to ignore, helping you identify the most impactful areas for improvement.
Step 4: Set Goals and Decide What to Fix First
Once you've analyzed your benchmarks, it's time to turn those insights into SMART goals - Specific, Measurable, Achievable, Relevant, and Time-bound [1]. For example, if your current conversion rate is 2.5%, but the industry average is 3.0%, you might aim for a 2.8% conversion rate within the next quarter. These clear targets help you focus on changes that will deliver the greatest results.
Focus on High-Impact Gaps First
Start by tackling the areas with the most potential for improvement. A common issue is the "Mobile Gap": mobile accounts for 70-75% of traffic but converts at just 1.8%, compared to desktop's 3.9% [3]. If mobile conversion is lagging, look at technical solutions like adding Apple Pay or Google Pay to make checkout smoother [3]. Rob T. Case, Founder of VonClaro, emphasizes the importance of small tweaks, noting:
A 0.5% increase in your conversion rate is often more profitable than a 20% increase in ad spend [3].
Use percentile data to prioritize your efforts wisely. If your conversion rates are already near the 75th percentile, further improvements may yield limited gains. Instead, focus on weaker areas, such as increasing average order value (AOV) through bundling or cross-selling. Similarly, if your cart abandonment rate is higher than the 70% industry average, address checkout issues before investing in new traffic [1].
Close Content Gaps
For brands that rely heavily on content, identifying and addressing gaps in bottom-funnel content - like product comparisons or reviews - can be especially impactful, as this type of content often converts 5-10 times better than top-funnel content [5]. If organic search generates 33% of your traffic but you're missing key comparison pages, this becomes an obvious priority [5]. Plan ahead for seasonal events like Black Friday by setting goals 6-8 weeks in advance to ensure your content gets indexed and ranked in time [5].
Align Goals with Resources
Finally, make sure your goals match the resources you have available. Rather than focusing on increasing ad spend, prioritize optimizing the traffic you already have. Build on your earlier data collection by aligning your KPI definitions - such as defining "cart abandonment" as no checkout within 24 hours - to avoid conflicting analyses [1]. Clear and consistent KPIs will help your team stay focused on the most impactful tasks.
Step 5: Use AI Tools to Automate Benchmarking
Once your goals are clearly defined, AI tools can streamline benchmarking, turning what used to be a weeks-long process of manual data collection and analysis into something that takes just minutes. Platforms like Averi AI, Google Analytics, and Shopify Analytics handle everything from gathering data to analyzing it and even generating actionable insights. As Mohamad Ali Baydoun, CTO of Lemonade Fashion, explains:
It's not just about saving time and money, it's about making data accessible [1].
By integrating AI, benchmarking becomes faster and more actionable.
Automate Data Analysis
AI platforms like Querio and Panoramata simplify data analysis by responding to plain-English queries with instant visual insights. For example, Shopify Benchmarks can automatically compare your store's performance against similar businesses using percentile data [1][4][6]. Instead of creating complex reports, you can ask straightforward questions like, "How does last month's cart abandonment rate compare to industry standards?" and get instant visualizations [1][4]. Shopify Benchmarks even breaks down percentile data into medians, 25th, and 75th percentiles, giving you a clear picture of your standing [6]. For brands focused on content, Averi AI integrates seamlessly with Shopify, automating tasks like product SEO, category content creation, and seasonal campaigns - all the way from strategy to publishing [5].
Monitor Competitors and Generate Insights
AI tools such as Panoramata can track over 1 billion creatives and monitor more than 100,000 companies, offering automated competitor benchmarks. This saves marketing teams an estimated 65 hours a month when tracking 10 competitors [4]. These platforms continuously scan competitor newsletters, ads, and landing pages, ensuring your decisions are based on up-to-date information rather than outdated pricing or strategies from six months ago [4][8]. For instance, in 2026, an online retailer used Querio to benchmark its cart abandonment rates against industry standards. This helped pinpoint specific friction points, leading to a 15% drop in abandonment rates within just one quarter [1]. Continuous monitoring like this ensures your strategies are always informed by real-time insights.
Monitor Performance in Real Time
Real-time dashboards are game-changers, especially during critical periods like Black Friday or seasonal promotions. They allow you to track trends as they emerge and make quick adjustments to your strategies [1]. To enable benchmarking in Google Analytics (GA4), go to Admin > Account Settings and activate "Benchmarking" along with "Modeling contributions and business insights" to access peer data [4]. Automated tracking ensures consistency across teams, as everyone pulls metrics from the same source of truth, eliminating conflicting analyses [1]. Modern AI tools also prioritize data security, using read-only connections and SOC 2 Type II certifications to protect sensitive information [1].
Conclusion
Benchmarking transforms raw numbers into meaningful strategies. By focusing on metrics like conversion rates, customer acquisition costs, and average order value, and then comparing your data to competitors and industry benchmarks, you create a clear path for growth. For instance, while a 2% conversion rate might seem reasonable, stacking it against an industry average of 2.86% reveals room for improvement [1].
AI tools have revolutionized this process, cutting down analysis time from weeks to mere minutes. These platforms provide instant, straightforward insights, making it easier to act quickly [1]. This speed enables businesses to make timely, strategic adjustments based on real data.
Benchmarking isn’t a one-time task - it’s a continuous cycle. Regularly evaluating your performance against competitors and industry trends helps you catch potential issues early, seize new opportunities, and focus your resources where they’ll have the most impact. Combining internal performance tracking with external benchmarks gives you a complete view of your position in the market and areas ripe for improvement [1][2].
Data-driven decisions reduce risks and fuel growth [2][4]. Benchmarking helps you make informed choices about marketing, pricing, and product strategies by showing you what’s already successful in your space [2][4]. With AI-powered tools offering real-time benchmarking, businesses of all sizes - from small DTC brands to enterprises - can build a foundation for steady, long-term success.
FAQs
How do I pick the right benchmarks for my product category and price point?
To determine the most relevant benchmarks, start by comparing your key metrics - such as conversion rates and average order value (AOV) - to industry norms. These standards can differ significantly depending on your category and pricing. For instance, AOVs typically fall between $50 and $150, while conversion rates often hover around 2.5% to 3.5%. Leverage tools or reports that provide platform-specific data, and factor in regional or demographic variations to establish practical, data-backed goals for growth.
What time period should I use for my baseline to avoid seasonality skewing results?
To ensure seasonality doesn't distort your benchmarking, establish a baseline period that spans at least 12 months. This approach captures performance trends across all seasons, including holidays and sales peaks, providing a more accurate reflection of average yearly patterns instead of short-lived fluctuations.
How often should I rerun benchmarking and update my goals?
To keep pace with the ever-evolving eCommerce landscape, it's a good idea to revisit your benchmarking efforts and update your goals on a consistent basis. Doing this at least every quarter - or whenever your business or market conditions shift significantly - can make a big difference. Regular reviews allow you to spot performance gaps, adjust your strategies, and set goals that are both realistic and grounded in current data.
Related Blog Posts

Zach Chmael
CMO, Averi
"We built Averi around the exact workflow we've used to scale our web traffic over 6000% in the last 6 months."
Your content should be working harder.
Averi's content engine builds Google entity authority, drives AI citations, and scales your visibility so you can get more customers.