In This Article
Retention is the lifeblood of apps—use onboarding, personalization, AI churn prediction and gamification to turn users into loyal customers.
Updated:
Trusted by 1,000+ teams
Startups use Averi to build
content engines that rank.
Retention is the key to app success. While acquiring new users costs five times more than keeping existing ones, 77% of users abandon apps within three days, and 90% leave within a month. Improving retention, even slightly, can transform your app's profitability and growth potential.
Key Takeaways:
Retention Benchmarks: Aim for 35–50% Day-1 retention and 10–20% Day-30 retention for top-tier performance.
Metrics to Track: Focus on Day-N retention, stickiness rate (DAU ÷ MAU × 100), and user engagement milestones.
Onboarding Matters: Highlight core value within 60 seconds to reduce drop-offs.
AI for Retention: Predict churn with up to 87% accuracy and automate personalized experiences.
Gamification Works: Features like streaks and rewards boost engagement by up to 25%.
Retention strategies include mapping user journeys, analyzing drop-offs, personalizing experiences, and leveraging AI for proactive campaigns. By focusing on these areas, you can improve user engagement, reduce churn, and maximize long-term value.
AI for Customer Retention: Reduce Churn and Increase Revenue
Mapping and Measuring the Retention Journey
To build effective AI-driven retention strategies, it’s essential to identify where users drop off. This starts with selecting the right metrics and tracking them with precision.
Defining Retention Metrics and User Cohorts
Focus on meaningful events - like completing a purchase, finishing onboarding, or achieving a first milestone - as indicators of active users [7]. These events make your DAU (Daily Active Users) and MAU (Monthly Active Users) metrics more relevant.
Beyond DAU and MAU, three key metrics form the foundation of retention analysis:
Metric | What It Measures | Best Used For |
|---|---|---|
Classic (Day-N) Retention | % of users returning on exactly Day N | Industry benchmarking |
Rolling (Day-N+) Retention | % of users returning on Day N or any day after | Apps with less frequent usage patterns |
Bracket Retention (Day N–M) | % of users returning within a specific date range | Apps with weekly usage, like meal planners or travel tools |
For apps where daily engagement isn’t typical - such as recipe planners or travel apps - bracket retention (e.g., Day 7–14) provides a clearer picture than a single Day-7 metric [1]. Pair these insights with the stickiness rate (DAU ÷ MAU × 100) to gauge how often your retained users are returning.
Segmenting users by acquisition channel can further reveal retention differences [5].
Tracking Key Events and Funnels
Identify the critical milestones along your user’s journey: app installation, account creation, onboarding completion, first meaningful action (e.g., logging a workout, saving an item, or sending a message), and first purchase, if relevant [1][10].
Create step-by-step funnels from these events to calculate where users drop off. For instance, if 60% of users sign up but only 30% complete onboarding, that 50% drop highlights a key area to address [9].
Tools like Mixpanel can help diagnose drop-offs and analyze user behavior, while Amplitude ties user actions to outcomes such as revenue or feature adoption. Firebase is a solid choice for real-time retention data and crash reporting, especially for teams new to analytics [8].
From here, dive deeper into the data to uncover actionable insights about user behavior.
Finding Drop-Off Points with Analytics
Funnel data pinpoints where users leave, while cohort analysis reveals who leaves and when. In Amplitude, compare the behavior of users who churned by Day 7 with those who stayed through Day 30. This can help identify the "Aha moment" - a key action that separates retained users from those who churn [1][10]. For Instagram, it was seeing a filtered photo for the first time; for Slack, it was receiving a teammate’s first message [10].
After spotting a drop-off point, segment further by device type, OS version, and acquisition source. Sometimes, a step that looks fine overall might be failing for a specific group, such as Android users on older devices or users from a particular ad campaign [9]. Tools like UXCam offer session replays and heatmaps, providing qualitative insights into issues like broken buttons or confusing UI elements that might not appear in funnel charts [6][8].
"Retention is a report card for your onboarding, UX, and product-market fit." - Enable3 [8]
As a benchmark, mobile apps with onboarding drop-off rates above 55% should raise concerns, while rates in the 20–30% range are considered strong [9]. If your drop-off rates are on the higher side, prioritize these areas for testing and improvement.
Designing Personalized Retention Experiences
To keep users engaged, it's crucial to create experiences that resonate with them on a personal level. Personalization plays a key role here, with data showing that AI-driven personalization can improve app retention rates by as much as 35% [4]. By addressing specific drop-off points identified earlier, this approach directly tackles the reasons users disengage.
Optimizing Onboarding for Each User
The first minute a user spends in your app is make-or-break. It's essential to showcase the app's core value immediately - before asking for sign-ups or permissions. For instance, if your ad highlights an AI photo transformation feature, the app's first screen should deliver that experience, not a registration form [1].
Customizing onboarding flows for individual users can make a significant difference. Take a fitness app as an example: one user might see a weight-loss-focused journey, while another is introduced to strength-training options. By using progressive disclosure, apps can gradually reveal advanced features when users demonstrate readiness through their behavior [2].
Personalizing Experiences Based on User Behavior
Demographics can tell you who your users are, but behavioral data reveals what they actually do. This information is far more effective for improving retention, enabling AI systems to predict churn risk with up to 87% accuracy [4].
Platforms like Braze use behavioral data to drive what’s called the Next Best Experience (NBE), delivering the most relevant message, feature, or offer based on a user’s activity and context [3]. For instance, someone logging workouts three times a week might receive notifications about new workout plans, while a less active user gets reminders to re-engage. Personalized push notifications tied to specific user behaviors achieve open rates of 8–15%, compared to just 2–4% for generic messages [1].
"Retention starts long before someone looks 'at risk.' If a customer never reaches value... churn is usually a matter of time." - Team Braze [3]
In addition to personalized notifications, gamification can further reinforce retention by turning engagement into a habit.
Using Gamification to Build Habits
Gamification works when it aligns with users’ goals rather than simply adding superficial points or badges. The most effective systems follow a simple cycle: a trigger (like a reminder), a routine (the desired action), and a reward (something meaningful). Adding variability to the rewards can increase engagement by making outcomes less predictable [1].
Gamification Lever | Estimated Impact on Day-7 Retention | Psychological Driver |
|---|---|---|
Daily Streaks | +15–25% | Loss Aversion |
Progressive Unlock Rewards | +10–20% | Achievement/Milestones |
Social Leaderboards | +8–15% | Relatedness/Competition |
Variable Reward Drops | +5–12% | Unpredictability/Curiosity |
Daily streaks are particularly effective because they tap into users’ desire to avoid losing progress. Data shows that users with 7-day streaks are three times more likely to stick around long-term compared to those without [4]. However, a single missed day can lead to frustration and churn. A simple solution is to offer features like streak freezes or short grace periods to keep users from feeling penalized for occasional lapses [1][2].
"The secret isn't making your app feel like a game: it's making progress feel inevitable and rewarding." - Phiture, App Growth Agency [4]
Building AI-Powered Retention Workflows
Gamification and personalization only deliver results when they’re part of automated, real-time workflows. Here, we’ll expand on earlier retention mapping by exploring how AI workflows can streamline impactful user interactions.
Setting Up a Centralized Retention Workspace
Before diving into automation, it’s critical to ensure your data is clean, connected, and actionable. This involves consolidating various data points, such as:
Behavioral signals: Session frequency, feature adoption, and drop-off trends.
User preferences: Data collected during onboarding.
Support friction points: Refund requests or complaints.
Transactional data: Purchase history and renewal timelines.
Disjointed tools can derail retention efforts, but a centralized workspace resolves this by combining strategy, content creation, and execution in one place. For example, Averi AI employs persistent brand memory to automatically apply your product’s context, eliminating the need to constantly re-explain details or juggle multiple integrations.
Feature | Centralized AI Workspace (e.g., Averi AI) | Standalone / Automation Tools |
|---|---|---|
Workflow Management | Adaptive orchestration built in | Manual configuration or external integrations |
Brand Memory | Learns once; persists across all tasks | Requires re-explaining context per session |
Human Oversight | Built-in review points for sensitive moments | Relies on external manual review |
Setup Time | Minimal; adaptive by design | Often involves significant manual setup |
From the outset, it’s essential to include human review for key moments like refund requests, account access issues, or early signs of churn in high-value customers. While automation provides scale, human judgment ensures trust and precision. With a unified data workspace, lifecycle campaigns can run seamlessly.
Automating Lifecycle Campaigns
Once your data is organized and your workspace is connected, you can automate high-impact campaigns like welcome sequences, churn prevention flows, and win-back campaigns.
Platforms like Braze and Iterable excel at triggering workflows based on real-time user behavior rather than rigid schedules. For instance:
Welcome sequences: During the first 7–14 days, guide users toward meaningful actions instead of sending generic "getting started" messages.
Churn prevention flows: Activate when behaviors like reduced session frequency, lower feature usage, or fewer message opens are detected. These flows dynamically segment users and launch cross-channel campaigns.
Win-back campaigns: Use a three-step sequence over 14–21 days. Start by acknowledging the user’s absence, then showcase a feature or value, and finally offer an incentive if they still haven’t re-engaged.
"The gains won't come from scaling for the sake of it. They'll come from using AI to stay relevant, respect consent, and coordinate journeys across channels." - Team Braze [3]
Creating Dynamic Offers and Incentives
Blanket discounts for inactive users often fail to deliver results and can be expensive. Instead, AI-powered, rule-based logic can tailor incentives to each user’s churn risk and value. For example:
A high-value user at risk of churning might receive a personalized extended free trial.
A lower-value user could get a simple re-engagement nudge without any discount.
To avoid overwhelming users, establish frequency caps across all channels - email, push, and SMS. Overlapping messages can frustrate users and lead to opt-outs. AI can prioritize higher-value messages and suppress less critical ones when multiple campaigns overlap.
"AI retention has to balance those two realities - more relevance without more creepiness. Trust is the limiter and the differentiator." - Team Braze [3]
Lastly, always measure the effectiveness of your workflows with holdout groups. By excluding a small percentage of users from automated journeys, you can evaluate whether your strategies are genuinely driving re-engagement or simply aligning with users who would have returned naturally. This ensures your campaigns are delivering measurable outcomes.
Improving Retention Through Data and Testing
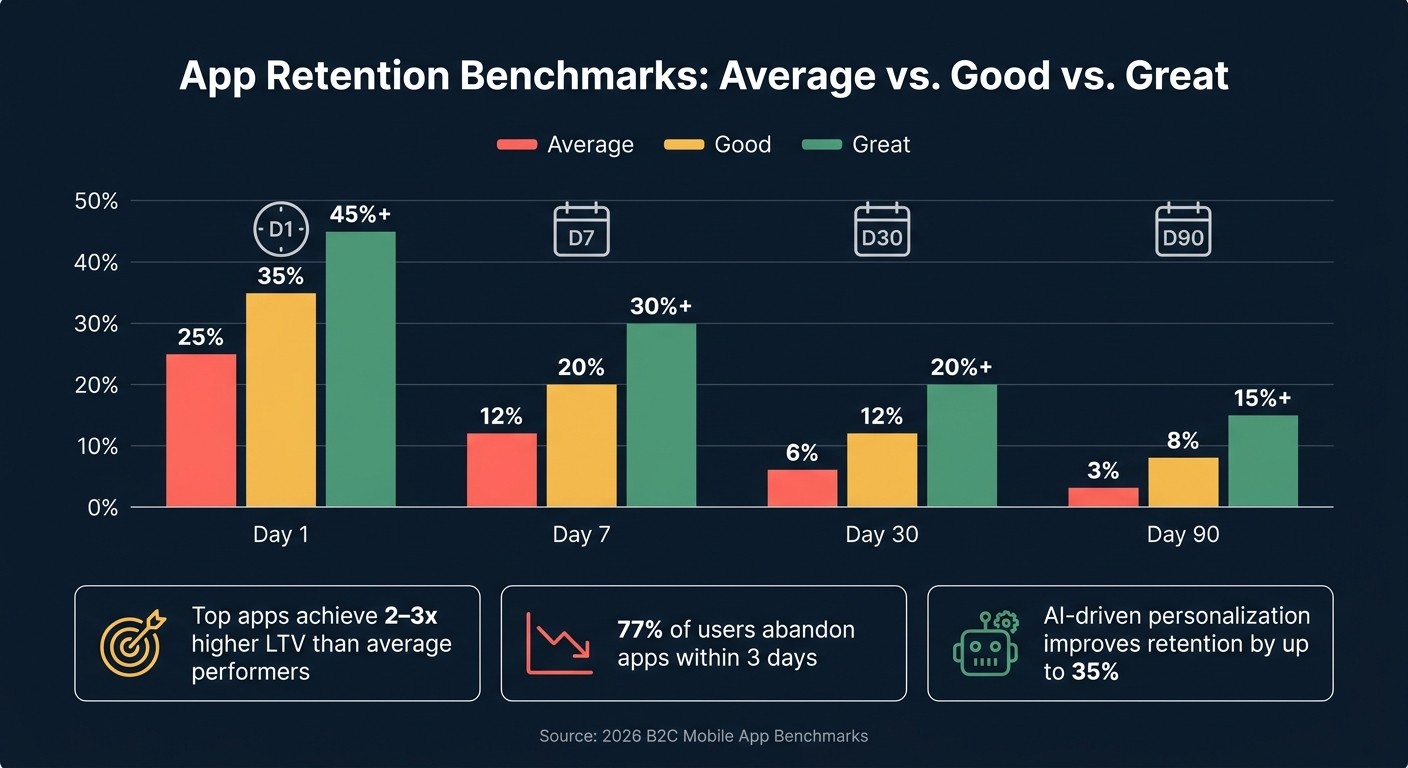
App Retention Benchmarks: Average vs. Good vs. Great
Data is the backbone of effective retention strategies, guiding everything from setting benchmarks to preventing churn. By combining retention mapping with AI-driven workflows, methods like baseline setting, A/B testing, and predictive analytics work together to create measurable improvements in user retention.
Setting Baselines and Performance Targets
Experimenting without a clear starting point makes it difficult to track real progress. Start by calculating your current retention rates using cohort data and compare them against industry benchmarks. In 2026, the typical B2C mobile app retains about 25–30% of users on Day 1, dropping to just 5–8% by Day 30. However, top-performing apps achieve Day-1 retention rates of 35–50% and Day-30 rates of 10–20% [1]. These differences are far from trivial: top-tier apps often see lifetime value (LTV) multiples of 2–3 times higher than average performers [1].
"Retention, not acquisition, is what separates successful apps from the millions that fail." - Unstar Editorial Team [10]
The table below offers retention benchmarks to aim for, helping you set improvement goals rather than just mirroring current averages:
Day | Average Retention | Good Retention | Great Retention |
|---|---|---|---|
Day 1 | 25% | 35% | 45%+ |
Day 7 | 12% | 20% | 30%+ |
Day 30 | 6% | 12% | 20%+ |
Day 90 | 3% | 8% | 15%+ |
Once you identify your current tier, track core metrics consistently. Monitor daily active users (DAU) and session duration daily, Day-1 and Day-7 retention weekly, and Day-30 retention alongside LTV curves monthly [1]. This regular cadence helps you filter out noise and focus on actionable trends. With benchmarks in place, structured testing can pinpoint areas for improvement.
Running Structured A/B Tests
After setting performance targets, use A/B testing to validate changes and measure their impact. Start with a clear hypothesis and focus on a single primary metric.
For onboarding flows, prioritize tests that help users reach their "aha moment" faster. This refers to the specific action - like sending a first message, completing a workout, or linking a bank account - that strongly correlates with long-term retention. Hila Qu, VP of Experiments and Retention at Acorns, explains it well:
"We want to learn which barriers we can remove so that users can achieve their goals as quickly as possible." [14]
Since Day-30 retention data takes time to collect, use proxy metrics for quicker insights. For example, track whether users complete onboarding steps or engage with core features within the first 7 days [13]. Tools like Firebase A/B Testing and Optimizely make it easier to experiment with feature flags, allowing you to test variations without waiting on app store approvals [15].
Follow these best practices for A/B testing:
Run variations simultaneously to avoid day-of-week biases.
Keep tests running for at least two weeks to ensure statistical significance [12].
Segment results by user type - such as iOS vs. Android or new vs. returning users - to uncover hidden patterns [11].
Be cautious of artificial gains. For instance, if Day-1 retention improves but Day-7 remains flat, your onboarding process might rely on short-term hooks rather than fostering meaningful habits [1]. Always evaluate both short- and long-term metrics.
Using Predictive Analytics to Get Ahead of Churn
Waiting for users to churn before taking action is expensive and often ineffective. Predictive analytics allows you to intervene earlier - often 5–10 days before a user is likely to leave [1].
These models assign a churn score (ranging from 0.0 to 1.0) to each user based on signals like reduced session frequency, limited feature usage, or shorter session durations. Users are then grouped into risk tiers, each with tailored responses:
High-risk users (0.8–1.0): Offer immediate incentives or initiate direct outreach.
Moderate-risk users (0.6–0.8): Send educational content or next-best-action prompts.
Low-risk users (<0.4): Continue standard lifecycle engagement [17].
By targeting the top 20% of at-risk users, you can recover over 80% of potential churners, significantly improving ROI compared to untargeted campaigns [19]. However, as Christine Dolce, Former Senior Digital Strategist at Acquia, advises:
"Always make sure that your predictive analytics platform is directly integrated with your marketing execution systems, such as your email service provider, website, call center, or POS system." [18]
For teams building their first churn models, ensure your training data includes at least 500 confirmed churn events and 500 non-churn events for reliable results [16]. If churn rates are low (under 15%), use techniques like SMOTE (Synthetic Minority Over-sampling Technique) to balance your dataset and improve model accuracy [20]. Once your model is live, aim for a precision rate of 60–75% and a lead time of at least 5 days to enable proactive interventions [1]. This early detection window is critical for effective churn prevention.
Conclusion: Retention Checklist and Key Takeaways
Retention operates as a system where each strategy builds on the others. Clear metrics show where you stand, personalized onboarding speeds up user engagement, proactive workflows address disengagement early, and structured testing drives consistent improvements. As Bryan Kim, Partner at Andreessen Horowitz, aptly states:
"Retention is the lifeblood of an app and the hardest metric to move." [21]
Here’s a checklist to help you implement these strategies effectively:
Set your benchmarks: Define Day-1, Day-7, and Day-30 metrics for each acquisition channel.
Streamline onboarding: Ensure users reach their "aha" moment within 60 seconds before requesting sign-ups or permissions [10].
Automate lifecycle messaging: Create action-based triggers, like a 3-touch sequence for inactive users (Day 3: value reminder, Day 5: social proof, Day 7: incentive) [1].
Incorporate gamification smartly: Features like daily streaks can boost Day-7 retention by 15–25%, but use streak freezes to reduce drop-offs.
Predict churn early: Use AI models with 60–75% precision to identify the top 20% of at-risk users at least five days in advance [1].
A/B test continuously: Experiment with one variable at a time, running tests for at least two weeks to measure both immediate and lasting impacts.
Close the feedback loop: Respond to NPS detractors (scores 0–6) within 24 hours. Remember, 72% of users will leave a brand after a single poor self-service experience [22].
FAQs
Which retention metric should I use for my app’s usage pattern?
The best way to measure how well your app retains users is by focusing on user retention rate, particularly on Day 1, Day 3, and Day 7. These metrics reveal how many users come back shortly after installing the app, providing a clear picture of early engagement and how quickly users form habits. For a broader perspective, looking at long-term metrics like 30-day retention can help assess ongoing loyalty and the overall value your app delivers.
How do I find my app’s “aha moment” using funnel and cohort data?
To figure out your app's "aha moment", dive into user behavior patterns to uncover when they first experience meaningful value that keeps them coming back. Analyze cohort data to see when a significant number of users return after onboarding - this often indicates they've tapped into the core value of your app. Additionally, review funnel data to identify specific actions or milestones linked to retention. These insights can guide adjustments to your onboarding and engagement strategies, helping users reach that moment more quickly.
What’s the safest way to use AI personalization without creeping users out?
The best way to approach AI-driven personalization is by focusing on relevance and openness. Craft messages that align with user behavior and preferences, steering clear of actions that might feel invasive or catch users off guard. AI can also play a key role in identifying early signs of disengagement, allowing you to provide timely and useful content. It's equally important to be clear about how data is used, give users control over personalization settings, and avoid overwhelming them with frequent messages or overly precise targeting. This ensures a better experience and fosters trust.
Related Blog Posts

Zach Chmael
CMO, Averi
"We built Averi around the exact workflow we've used to scale our web traffic over 6000% in the last 6 months."
Your content should be working harder.
Averi's content engine builds Google entity authority, drives AI citations, and scales your visibility so you can get more customers.