In This Article
Benchmarks and targets for B2B web, email, social, and funnel metrics, plus AI-driven ways to optimize content.
Updated:
Trusted by 1,000+ teams
Startups use Averi to build
content engines that rank.
In B2B marketing, content engagement goes beyond basic metrics like page views. It's about understanding how your audience interacts with your content - time spent, clicks, and actions taken - and using this data to guide them closer to making a decision. This article breaks down benchmarks across web, email, and social media, offering actionable insights to improve performance at every stage of the buyer journey.
Key Takeaways:
Web Metrics: Median bounce rate is 48.27%; top-performing engagement rates reach 55-65%.
Email Metrics: Average open rates range from 21.5% to 28%, with click-through rates around 2.8%.
Social Media: LinkedIn Ads have a median CTR of 0.63%, while Google Ads perform higher at 4.37%.
Funnel Stages: Conversion rates vary - TOFU content converts at 0.5%-2%, MOFU at 3%-8%, and BOFU at 5%-15%.
AI's Role: AI tools like Averi AI can streamline processes, reduce production time, and improve content performance.
The benchmarks outlined here can help you measure success, identify gaps, and refine your B2B marketing strategy to drive measurable results.
Contentful x Benchmarker: 2026 B2B SaaS Content and Website Performance Benchmarks
Key Metrics for Measuring B2B Content Engagement
When it comes to tracking content performance in the B2B space, engagement metrics can vary based on the type of content, its purpose, and where the buyer is in their journey. Typically, these metrics are divided into four main categories: traffic, engagement, conversions, and pipeline influence[7].
Web and Blog Content Metrics
For blogs and websites, some of the most important metrics include bounce rate, engagement rate, average session duration, and pages per session. Based on Databox's September 2024 B2B SaaS benchmark data, the median bounce rate is 48.27%, while the median engagement rate is 52.93%, and the average session duration clocks in at 2 minutes and 34 seconds[6]. High-performing sites in this space often achieve engagement rates ranging from 55% to 65%[7].
Interestingly, if a page shows a high time-on-page but also a high bounce rate, it could mean the content is helpful but lacks a clear call-to-action (CTA)[7]. Placing a CTA around 50–60% of the way through a post can drive conversions at rates 2–3 times higher than CTAs in sidebars or footers[4].
Long-form content (2,000+ words) proves its worth by generating three times more backlinks than shorter articles[4]. Additionally, while case studies and comparison pages may not attract massive traffic, they excel at conversions. Case studies typically convert at rates between 2% and 5%, and comparison pages can reach 3% to 8%[5]. Email performance also provides valuable insights into how content drives prospects further along the funnel.
Email Engagement Metrics
Email interactions offer another layer of understanding about audience engagement. For B2B SaaS, the average email open rate ranges from 21.5% to 28%, with click-through rates (CTR) averaging 2.8% for newsletters[5][7]. Targeted nurture sequences tied to actions like content downloads or demo requests tend to outperform general broadcast newsletters because they align more closely with user intent.
If open rates dip below 20% or CTR falls under 2%, it’s a clear signal to revisit your approach. This might mean refining subject lines, improving list segmentation, or ensuring the content aligns with subscriber interests. An unsubscribe rate above 0.5% per send is another warning that your content isn't resonating with your audience[5].
Social Media and Paid Media Metrics
On social media, LinkedIn continues to dominate as the go-to platform for B2B, but its ad performance benchmarks differ significantly from Google Ads. LinkedIn Ads have a median CTR of 0.63% and a median CPC of $3.96, while Google Ads boast a median CTR of 4.37% with a CPC of $1.45[8]. This disparity reflects the difference in user intent: Google captures active searchers, while LinkedIn reaches users mid-scroll.
"The key isn't just to give users what they're searching for – it's to do it in such a way that they won't find the same recycled answer on all of the top-ranking SERPs." - Nevena Rudan, Senior Content Marketing Strategist, Databox[6]
One major trend reshaping how B2B teams interpret these metrics is the impact of Google's AI Overviews. These have led to a 49% increase in search impressions but simultaneously caused organic click-through rates to drop by nearly 30%[1]. As a result, while your content might be more visible, it’s likely drawing fewer clicks. To get a clearer picture of your reach, it’s essential to track impressions alongside CTR rather than relying solely on click data.
Platform | Median CTR | Median CPC |
|---|---|---|
Google Ads | 4.37% | $1.45 |
2.10% | $0.88 | |
Facebook Ads | 1.54% | $0.54 |
LinkedIn Ads | 0.63% | $3.96 |
Source: B2B Paid Media Benchmarks, November 2023/2024 data [8]
Matching Benchmarks to the B2B Buyer Journey
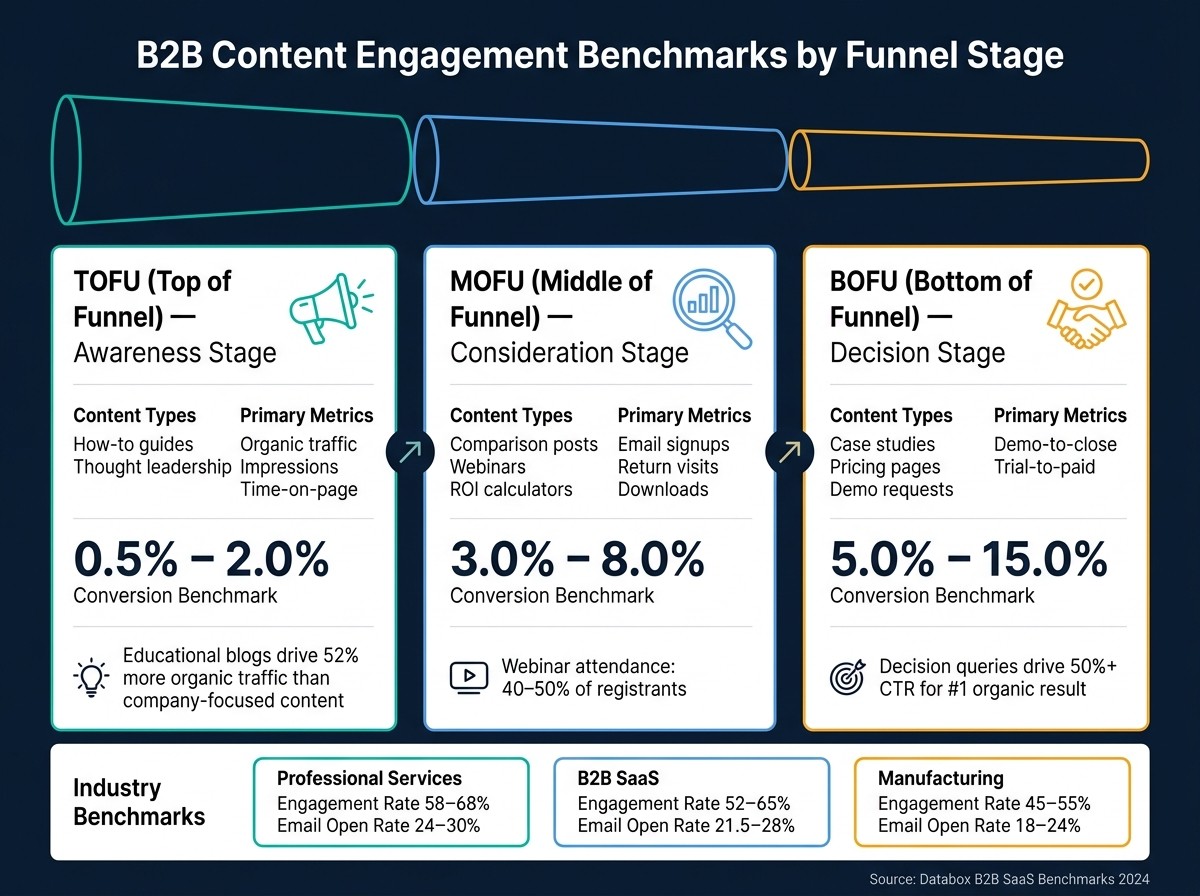
B2B Content Engagement Benchmarks by Funnel Stage
Engagement metrics shift in importance depending on where a buyer is in their journey. A number that signifies success at the awareness stage might not hold the same weight during the decision stage. The key is knowing which metrics matter at each step and interpreting them effectively. Below, we break down benchmarks by funnel stage to help you focus on the right signals at the right time.
Benchmarks by Funnel Stage
At the awareness stage (TOFU), the goal is discovery. Metrics like organic traffic, impressions, and time-on-page take center stage here. Educational blogs and guides tend to perform well, driving 52% more organic traffic than content focused solely on the company [2]. Visitor-to-lead conversion rates typically fall between 0.5% and 2.0% for broad, informational content [7].
Moving into the consideration stage (MOFU), many B2B teams falter by underinvesting in this critical phase. Yet, MOFU content, such as comparison pages and webinars, converts 3–8 times higher than TOFU content [5]. Metrics like return visits, gated content downloads, and email signups are key indicators of progress. Conversion rates for MOFU content generally range from 3.0% to 8.0% [5].
At the decision stage (BOFU), the focus narrows to pipeline-driving actions. Metrics like demo requests, trial signups, and pricing page visits become paramount. Pricing and trial pages often convert at rates of 5.0% to 15.0%, while top-performing B2B companies average 8 MQLs and 1.2 customers per 1,000 blog visitors [5]. Additionally, decision-focused queries can drive click-through rates (CTRs) exceeding 50% for the #1 organic result, compared to around 20% for informational queries [1].
Funnel Stage | Content Types | Primary Metrics | Conversion Benchmark |
|---|---|---|---|
TOFU | How-to guides, thought leadership | Organic traffic, impressions, time-on-page | 0.5% – 2.0% |
MOFU | Comparison posts, webinars, ROI calculators | Email signups, return visits, downloads | 3.0% – 8.0% |
BOFU | Case studies, pricing pages, demo requests | Demo-to-close, trial-to-paid | 5.0% – 15.0% |
These benchmarks provide a solid framework for evaluating performance at each stage. But industry nuances and content types add another layer of complexity.
How Benchmarks Vary by Industry and Content Format
What counts as "good" performance often depends on your industry. For example, Professional Services companies typically see the highest engagement rates, ranging from 58% to 68%, with email open rates between 24% and 30%. This reflects a buyer base that values relationships and conducts extensive research [7]. B2B SaaS, on the other hand, experiences slightly lower engagement but benefits from shorter sales cycles and more frequent digital interactions. Meanwhile, Manufacturing averages engagement rates of 45% to 55%, with email open rates of 18% to 24%, likely due to a less digitally active audience [7].
The format of your content also plays a major role. Webinars stand out as a reliable MOFU tool, with attendance rates of 40% to 50% of registrants [7]. Long-form guides (2,500+ words) outperform shorter posts, converting at 2 to 4 times the rate of content under 1,000 words [5]. For technical B2B audiences, detailed how-to articles in the 1,800 to 2,500-word range tend to resonate most [2].
Nevena Rudan, Senior Content Marketing Strategist at Databox, emphasizes the importance of interpreting benchmarks in context:
"Benchmarks only become useful when you can clearly interpret what they mean for your own performance." [6]
Layering industry insights onto your benchmarks and tracking format-specific performance is essential. For example, a 2% conversion rate on a manufacturing blog exceeds the 1% to 2.5% category average [7]. That means your focus should shift to refining content formats and repurposing strategies rather than questioning your overall approach.
Using AI to Improve Content Engagement
Understanding your benchmarks is just the starting point; acting on them quickly is what drives results. Relying on manual workflows to gather data from GA4, CRM systems, and marketing tools can slow down decision-making. AI transforms this process, enabling faster, more efficient integration of benchmarks with actionable insights.
AI Tools for Benchmarking and Analysis
AI platforms streamline workflows by consolidating multiple tools into a single process. Instead of juggling spreadsheets, AI identifies insights automatically and provides clear next steps. By 2025, 89% of B2B marketers will use AI for content creation [2], yet only 19% will have fully integrated it into their daily operations [3]. This gap highlights unrealized potential for performance improvements.
Averi AI addresses this challenge directly. It tracks metrics like impressions, clicks, and keyword rankings, then delivers actionable recommendations. For example, it identifies posts stuck at position #8 that need a boost, flags topics recently covered by competitors, and pinpoints low-competition keywords that resonate with your audience [9]. Instead of leaving users to interpret dashboards, Averi AI highlights underperforming content and suggests precise next steps.
"Use AI to automate the boring stuff that gets in the way of creativity. Use it to free up time to be more strategic and creative." - Ann Handley, Chief Content Officer, MarketingProfs [3]
With these tools, AI facilitates a seamless cycle of ongoing content improvement.
AI-Driven Content Improvement Loops
The real power of AI lies in its ability to create a continuous optimization loop: analyze performance, pinpoint gaps, implement improvements, publish, and repeat. Teams using Averi's content engine reported a 68% reduction in production time per post [9]. But it’s not just about speed - successful teams reinvested the time saved into areas like original research, expert interviews, and conversion testing, which led to an average 340% increase in content performance over 12 months [9].
Here’s a concrete example: in early 2026, a marketing team leveraging Averi tested 12 different CTA variants and lead magnet offers across their 20 highest-traffic blog posts. This rapid experimentation reduced their visitor-to-trial conversion time from 3.2 weeks to 1.4 weeks [5]. Such rapid iteration is nearly impossible with manual workflows.
Workflow Step | Manual Process | AI-Assisted (e.g., Averi AI) |
|---|---|---|
Research & Outlining | 4–8 hours per post | 15–30 minutes |
Drafting | 1–2 days | 1–2 hours (with human editing) |
SEO Optimization | Manual keyword insertion | Automated SEO + GEO optimization [9] |
Performance Analysis | Manual data merging from 3+ tools | Unified, real-time benchmark tracking [7] |
Optimization Cycle | Quarterly or bi-annual audits | Continuous testing and iteration [5] |
One critical takeaway: AI output still requires human refinement. Content created with AI and thoroughly edited by humans achieves a 61% success rate in reaching top 10 rankings, compared to just 14% for unedited AI output [9]. The key isn’t choosing between AI and humans - it’s ensuring content is well-edited.
"The performance gap is not AI vs human - it's edited vs unedited." - Averi Editorial Team [9]
These AI-driven cycles align perfectly with a strategy focused on agile, data-informed content optimization.
Setting Engagement Targets and Maintaining Data Quality
Turning Benchmarks into Targets
Benchmarks provide a snapshot of industry norms, while targets set the bar for your team's specific goals. Here's the distinction: KPIs reflect internal objectives, whereas benchmarks validate whether those objectives are achievable based on external standards [7]. Without leveraging benchmarks, you risk setting goals that are either too easy or too ambitious.
A smart way to approach this is to evaluate your current performance, compare it to industry data, and then focus on narrowing the most critical gap in your funnel for a full quarter. Trying to tackle every weakness at once often leads to scattered efforts with limited results [7].
Here's how B2B content metrics align with targets:
Metric | Conservative Target | Median Benchmark | Top Quartile Target |
|---|---|---|---|
Blog Visitor-to-Subscriber | 1% | 2% | 4% [5] |
Subscriber-to-MQL (90 days) | 3% | 8% | 18% [5] |
MQL-to-Customer (Sales-led) | 15% | 22% | 30% [5] |
B2B SaaS Engagement Rate | 45% | 56% | |
Interactive Quiz Completion | <60% | 70% | 85–95% [10] |
One critical insight: B2B companies often over-prioritize top-of-funnel content, which makes up 67% of production. However, middle-of-funnel content can convert at rates 3–8 times higher [5][1]. If you're struggling to hit your targets, this imbalance might be the root cause.
Sustaining these improvements depends on strong data governance and consistent tracking practices.
Data Governance and Tracking Best Practices
Reliable data is the foundation of an effective, AI-driven content strategy. It ensures that every adjustment you make is backed by evidence. Establishing a structured reporting cadence is key: track traffic and engagement weekly, assess conversion and pipeline metrics monthly, and compare your performance to industry benchmarks quarterly [7]. This schedule keeps you agile without overwhelming your team with endless dashboards.
A common pitfall is monitoring too many metrics. Sticking to 5–8 core engagement metrics tailored to your business prevents analysis paralysis and keeps your focus sharp [6]. Combine this with multi-touch attribution - whether linear or position-based models - to ensure early-funnel content gets the recognition it deserves, avoiding the pitfalls of last-click reporting [7].
"Benchmarks matter because they turn raw metrics into actionable signals, revealing exactly where a content program is losing value and what to fix first." - Sona Editorial Team [7]
On the governance side, 56% of B2B marketers struggle to attribute ROI to content, and 37% cite data silos as a major hurdle [3]. AI tools are stepping in to address these issues, bridging gaps between platforms like GA4, CRM systems, and marketing automation tools. These tools reduce manual data cleaning and enhance reporting accuracy [7][6]. For instance, Averi AI consolidates data streams into a unified dashboard, freeing teams from tedious spreadsheet work and enabling quicker, data-informed decisions [9].
Make it a habit to conduct content audits at least twice a year to identify outdated or underperforming assets that may be dragging down conversion rates [1]. A great example comes from Oakland Community College, which streamlined its admissions pages in 2025 by revising copy and adding clearer calls-to-action. The result? A 250% increase in conversions within just five weeks [1]. Often, the content isn’t broken - it just needs a thoughtful review to unlock its potential.
Conclusion: Building a Data-Driven B2B Content Strategy
The main point here is clear: benchmarks only matter if they lead to meaningful action. This focus on data addresses a common issue in B2B content strategies - misalignment between goals and actual results.
Consider this: 58% of B2B marketers describe their content strategy as merely "moderately effective", with 42% pointing to unclear goals as the main culprit [3]. The disconnect between effort and outcomes often stems from poor goal-setting, not the quality of the content itself. The best-performing strategies tie every metric - whether it’s traffic, engagement, or conversions - back to pipeline influence and revenue impact. That’s what sets successful programs apart from those that stagnate.
Content marketing in the B2B world is a long game. It typically takes 12–18 months to see a positive ROI, with returns often exceeding 6x after 24 months [4]. This timeline makes consistency absolutely essential. That’s where AI tools prove their value. For example, platforms like Averi can cut production time per post by an average of 68% [9]. The real advantage comes from blending AI’s efficiency with human expertise to refine tone, judgment, and positioning - factors that build genuine trust with buyers. By using tools like Averi, these insights can be turned into actionable improvements.
To move forward, focus on the largest gap in your funnel, set a measurable quarterly goal, and track progress using these benchmarks. Governance, attribution, and regular audits will help keep everything aligned.
FAQs
Which engagement metrics matter most for my funnel stage?
For top-of-funnel (TOFU) content, it's all about tracking how well you're attracting and engaging your audience. Key metrics include organic traffic, bounce rate, engagement rate, pages per session, and time on page. These indicators help measure whether your content is pulling in visitors and keeping them interested.
As you move to the middle-of-funnel (MOFU) and bottom-of-funnel (BOFU) stages, the focus shifts to conversion-based metrics. Here, keep an eye on numbers like visitor-to-lead conversion rates, subscriber-to-MQL rates, and MQL-to-customer rates. These metrics reveal how effectively you're nurturing leads and turning them into customers.
When it comes to click-through rates (CTR), intent plays a big role. Informational queries often have lower CTRs, while commercial queries - where users are closer to making a decision - tend to show higher CTRs.
How can I set realistic targets using these benchmarks?
When setting targets, it's crucial to focus on metrics that directly support your business goals and resonate with your industry and audience. Instead of chasing vanity metrics, prioritize 5–8 key performance indicators (KPIs) that truly drive impact. Start by analyzing your historical data to establish benchmarks, and then compare these to similar B2B businesses to uncover potential areas for growth. Additionally, segment your content by its intent - whether it's top-of-funnel (TOFU), middle-of-funnel (MOFU), or bottom-of-funnel (BOFU) - since metrics like click-through rates and conversions can vary significantly depending on where users are in their buying journey.
How can AI help improve content engagement without hurting quality?
AI streamlines the content creation process by handling repetitive drafting tasks, allowing human teams to dedicate their time to high-value activities such as conducting original research and sharing expert perspectives. Research indicates that content created with AI assistance, when paired with careful human editing, can perform just as well as, if not better than, content crafted solely by humans. To ensure top-tier quality, leverage AI for organizing and structuring content while relying on human input to infuse expertise and empathy - essential components for fostering trust and creating the emotional connections that boost engagement.
Related Blog Posts

Zach Chmael
CMO, Averi
"We built Averi around the exact workflow we've used to scale our web traffic over 6000% in the last 6 months."
Your content should be working harder.
Averi's content engine builds Google entity authority, drives AI citations, and scales your visibility so you can get more customers.