In This Article
Use analytics to lower CAC, boost LTV, and cut churn in B2B SaaS. Learn which metrics, tools, and attribution models connect marketing to revenue.
Updated:
Trusted by 1,000+ teams
Startups use Averi to build
content engines that rank.
Using marketing analytics effectively can transform how B2B SaaS companies grow. With buyers navigating hundreds of touchpoints and Customer Acquisition Costs (CAC) soaring by 180% in 2026, relying on intuition is no longer an option. Analytics provides clarity on metrics like CAC, Lifetime Value (LTV), and churn, ensuring every dollar spent contributes to measurable outcomes. Companies that prioritize data-driven decisions see up to 25% higher ROI and 34% faster revenue growth.
Key takeaways:
Track essential KPIs and metrics: CAC, LTV, churn rate, and marketing-influenced pipeline.
Adopt the right tools: Google Analytics 4 for website tracking, Mitzu for retention, and Sona for attribution.
Integrate data systems: Connect CRMs, marketing platforms, and analytics for a unified view.
Focus on ROI: Align campaigns with metrics that directly impact revenue.
June - Product analytics for B2B SaaS
Key Metrics to Track for B2B SaaS
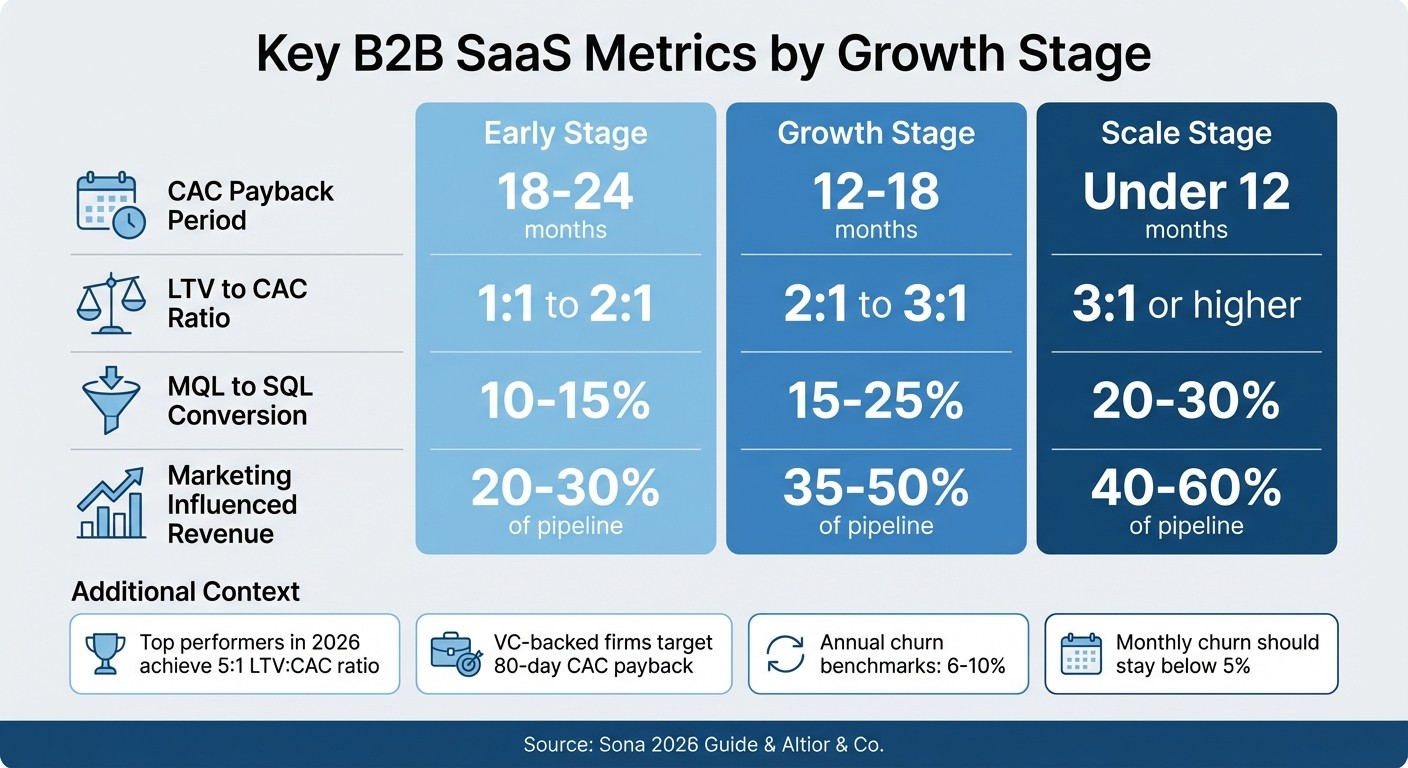
B2B SaaS Key Metrics Benchmarks by Growth Stage
Monitoring the right metrics has never been more critical - B2B SaaS Customer Acquisition Costs saw a staggering 180% increase in 2026 [8]. Understanding unit economics is no longer optional but essential for survival. Here's a breakdown of the key metrics and their role in shaping a data-driven approach.
Customer Acquisition Cost (CAC) and Payback Period
Customer Acquisition Cost (CAC) measures the total sales and marketing expenses incurred to acquire a single customer [1]. Across SaaS industries, the average CAC is $704 [2], though costs can vary significantly by channel. For instance, acquiring a customer through paid ads might cost $900, while organic search could lower that to $300. Such insights can guide smarter budget allocation [4].
The CAC Payback Period reveals how long it takes to recover acquisition costs. Growth-stage companies should aim for a payback period under 12 months [1], while VC-backed firms often target an aggressive 80-day payback for cash-efficient scaling [8]. A notable example is TestGorilla, which hit this 80-day mark in 2025 by leveraging advanced analytics to fine-tune acquisition channels [8].
Analyzing channel-specific CAC can pinpoint which marketing efforts yield the best results. In late 2025, Altior & Co. helped a B2B SaaS client discover that one ad channel was bringing in low-value customers. By reallocating budgets to higher-value channels, the client boosted their trial-to-paid conversion rate from 12% to 18% within six weeks [3].
Lifetime Value (LTV) and LTV:CAC Ratio
Once acquisition costs are clear, the focus shifts to revenue potential. Lifetime Value (LTV) estimates the total revenue a customer generates throughout their relationship with your company [6]. The LTV:CAC ratio assesses acquisition profitability and long-term sustainability.
A ratio of at least 3:1 is considered healthy for growing SaaS businesses [1], while top performers in 2026 are achieving 5:1 or more [8]. Falling below 3:1 suggests either overspending on acquisition or poor customer retention.
"Your attribution model needs to mirror your customer's journey, not just the final click. The goal isn't a perfect score, but a clearer direction for your next dollar." - Avinash Kaushik, Digital Marketing Evangelist [7]
Calculating LTV by cohort rather than as a single aggregate figure can reveal hidden profitability. For example, enterprise clients may show a much higher LTV compared to SMBs, signaling a need to adjust messaging and sales strategies [4].
Churn Rate and Retention Metrics
Churn rate measures the percentage of customers lost over a given period and is one of the biggest barriers to growth [4]. In 2026, annual churn benchmarks range from 6% to 10%, while monthly churn should ideally stay below 5% [8][6]. Lowering churn directly impacts revenue growth and marketing efficiency.
Revenue churn, which accounts for the loss of high-value accounts, often provides deeper insights than customer churn alone. High churn rates may point to onboarding issues, misaligned expectations, or product-market fit challenges. Segmenting churn by acquisition channel can help identify root causes [4]. Early activation metrics, such as users skipping onboarding or failing to engage with key features, can also flag accounts at risk of early churn [4].
A Net Revenue Retention (NRR) rate above 100% shows that your business is growing through upsells and expansions, reducing dependence on constant new customer acquisition [6].
Marketing-Influenced Pipeline and Revenue Contribution
Marketing's role in driving revenue extends beyond acquisition. Marketing-influenced pipeline measures how many deals have been touched by marketing at any point in the buyer's journey [4]. At the scale stage, marketing typically influences 40% to 60% of the pipeline [1].
Key conversion rates include:
Lead-to-MQL conversion: Generally ranges from 2% to 5% [7].
MQL-to-SQL conversion: Should ideally fall between 15% and 20%; anything less may indicate misalignment between sales and marketing [3][7].
SQL-to-close rates: Well-aligned teams often achieve 20% to 30% [3][7].
In 2025, TripMaster added $504,758 in Net New ARR by implementing a revenue-focused measurement framework that prioritized SQL pipeline conversion and ARR payback periods [8].
Metric | Early Stage | Growth Stage | Scale Stage |
|---|---|---|---|
CAC Payback Period | 18-24 months | 12-18 months | Under 12 months |
LTV to CAC Ratio | 1:1 to 2:1 | 2:1 to 3:1 | 3:1 or higher |
MQL to SQL Conversion | 10-15% | 15-25% | 20-30% |
Marketing Influenced Revenue | 20-30% of pipeline | 35-50% of pipeline | 40-60% of pipeline |
Source: Sona 2026 Guide [1] and Altior & Co. [7]
Another metric worth tracking is funnel velocity, which measures the speed at which leads progress through each stage of the pipeline. Faster funnel velocity often signals greater efficiency [1].
Marketing Analytics Tools for B2B SaaS
To succeed, B2B SaaS marketers need analytics tools that go beyond surface-level metrics. The goal is to connect the dots between web traffic, product usage, and revenue outcomes - not just to monitor dashboards filled with vanity stats.
Google Analytics 4 for Website and Conversion Tracking
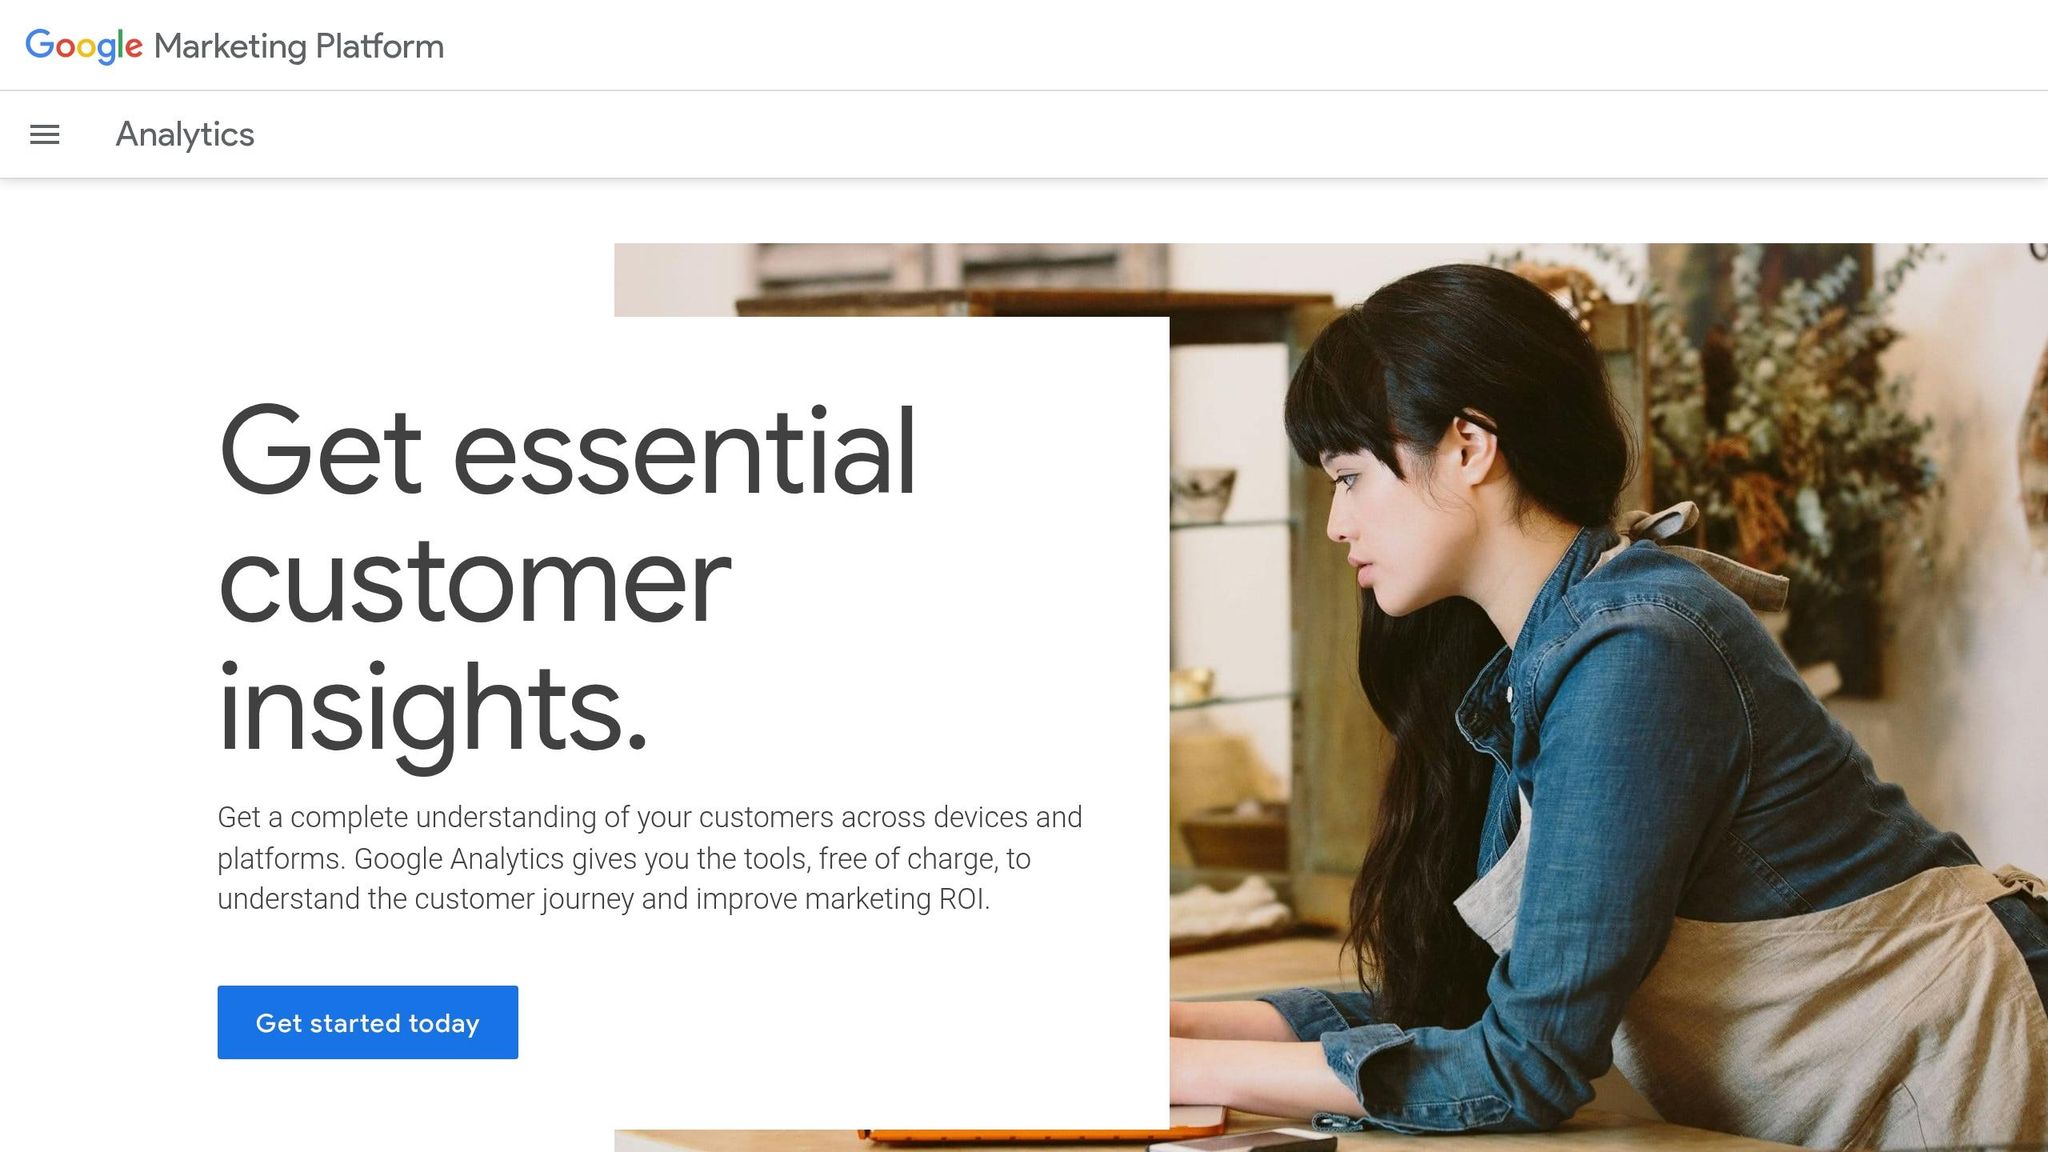
Google Analytics 4 (GA4) provides the backbone for understanding how prospects interact with your website and convert into leads. Unlike earlier versions, GA4 allows you to define custom events tailored to SaaS businesses - like trial_start, demo_request, or mql_submit - and track user activity across domains using Google Tag Manager [9][10]. This ensures a seamless flow of data from your marketing site to your product environment.
What makes GA4 especially powerful is its integration with Google Ads. Companies that connect the two platforms report a 23% boost in conversions and a 10% drop in cost per conversion [9]. By exporting GA4 data to BigQuery, you can combine website activity with CRM revenue records, giving you a full view of how early interactions contribute to long-term customer value. This kind of tracking lays the groundwork for advanced analyses like cohort studies and attribution modeling.
Mitzu for Cohort and Retention Analysis
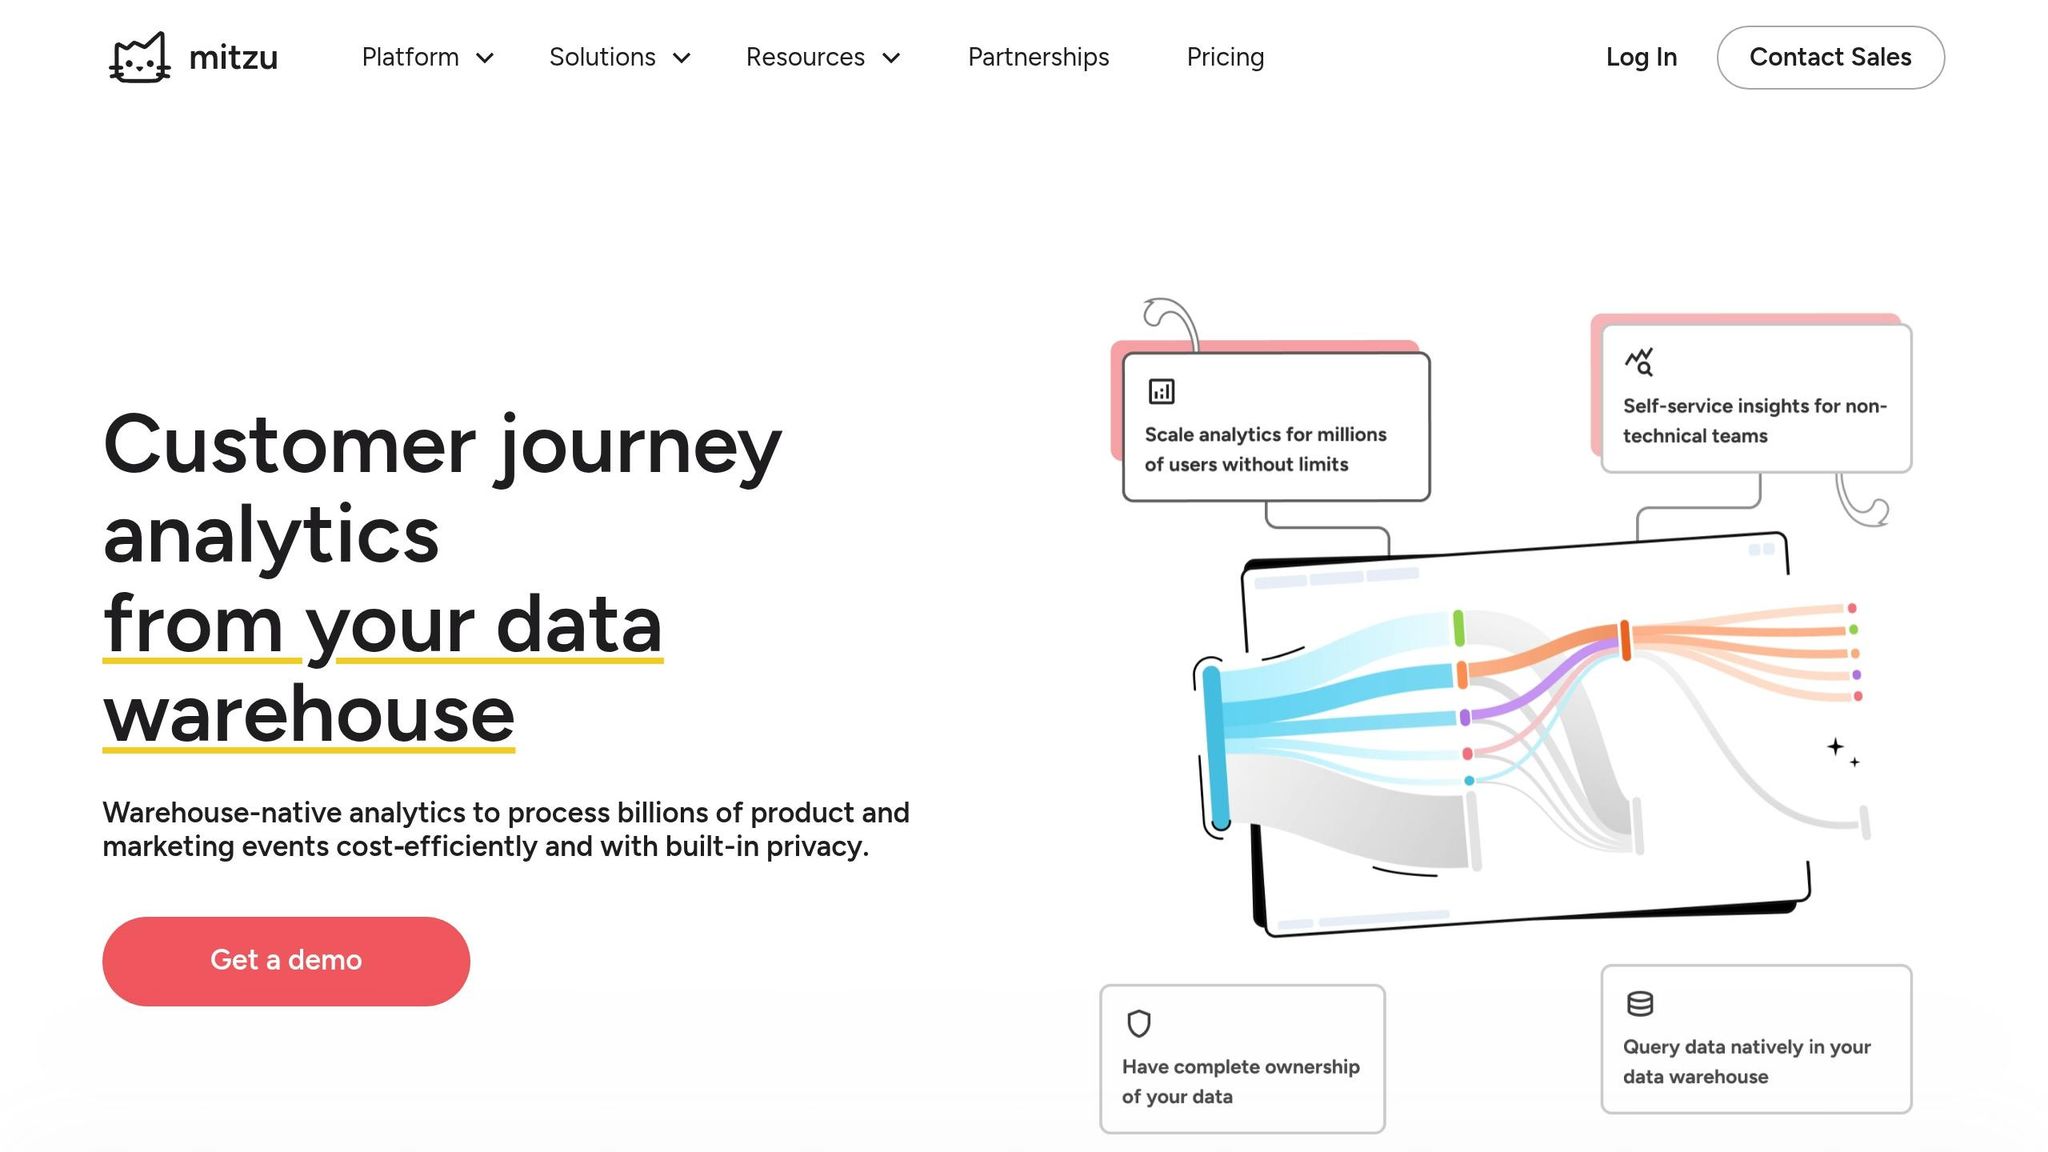
Mitzu takes a unique approach by working directly with your data warehouse, whether that’s Snowflake, BigQuery, or Redshift [10]. Its warehouse-native setup eliminates the data silos that often plague traditional analytics tools, delivering real-time insights into funnels and retention directly from your existing infrastructure. Notably, Mitzu was ranked #1 for SaaS analytics in 2026, thanks to its ability to streamline data workflows [10].
For B2B SaaS teams, Mitzu shines in cohort analysis. It allows you to segment users by acquisition source, compare retention rates across pricing models, and pinpoint where prospects drop off in their activation journey - all without the hassle of manual event tagging.
Sona for Multi-Touch Attribution
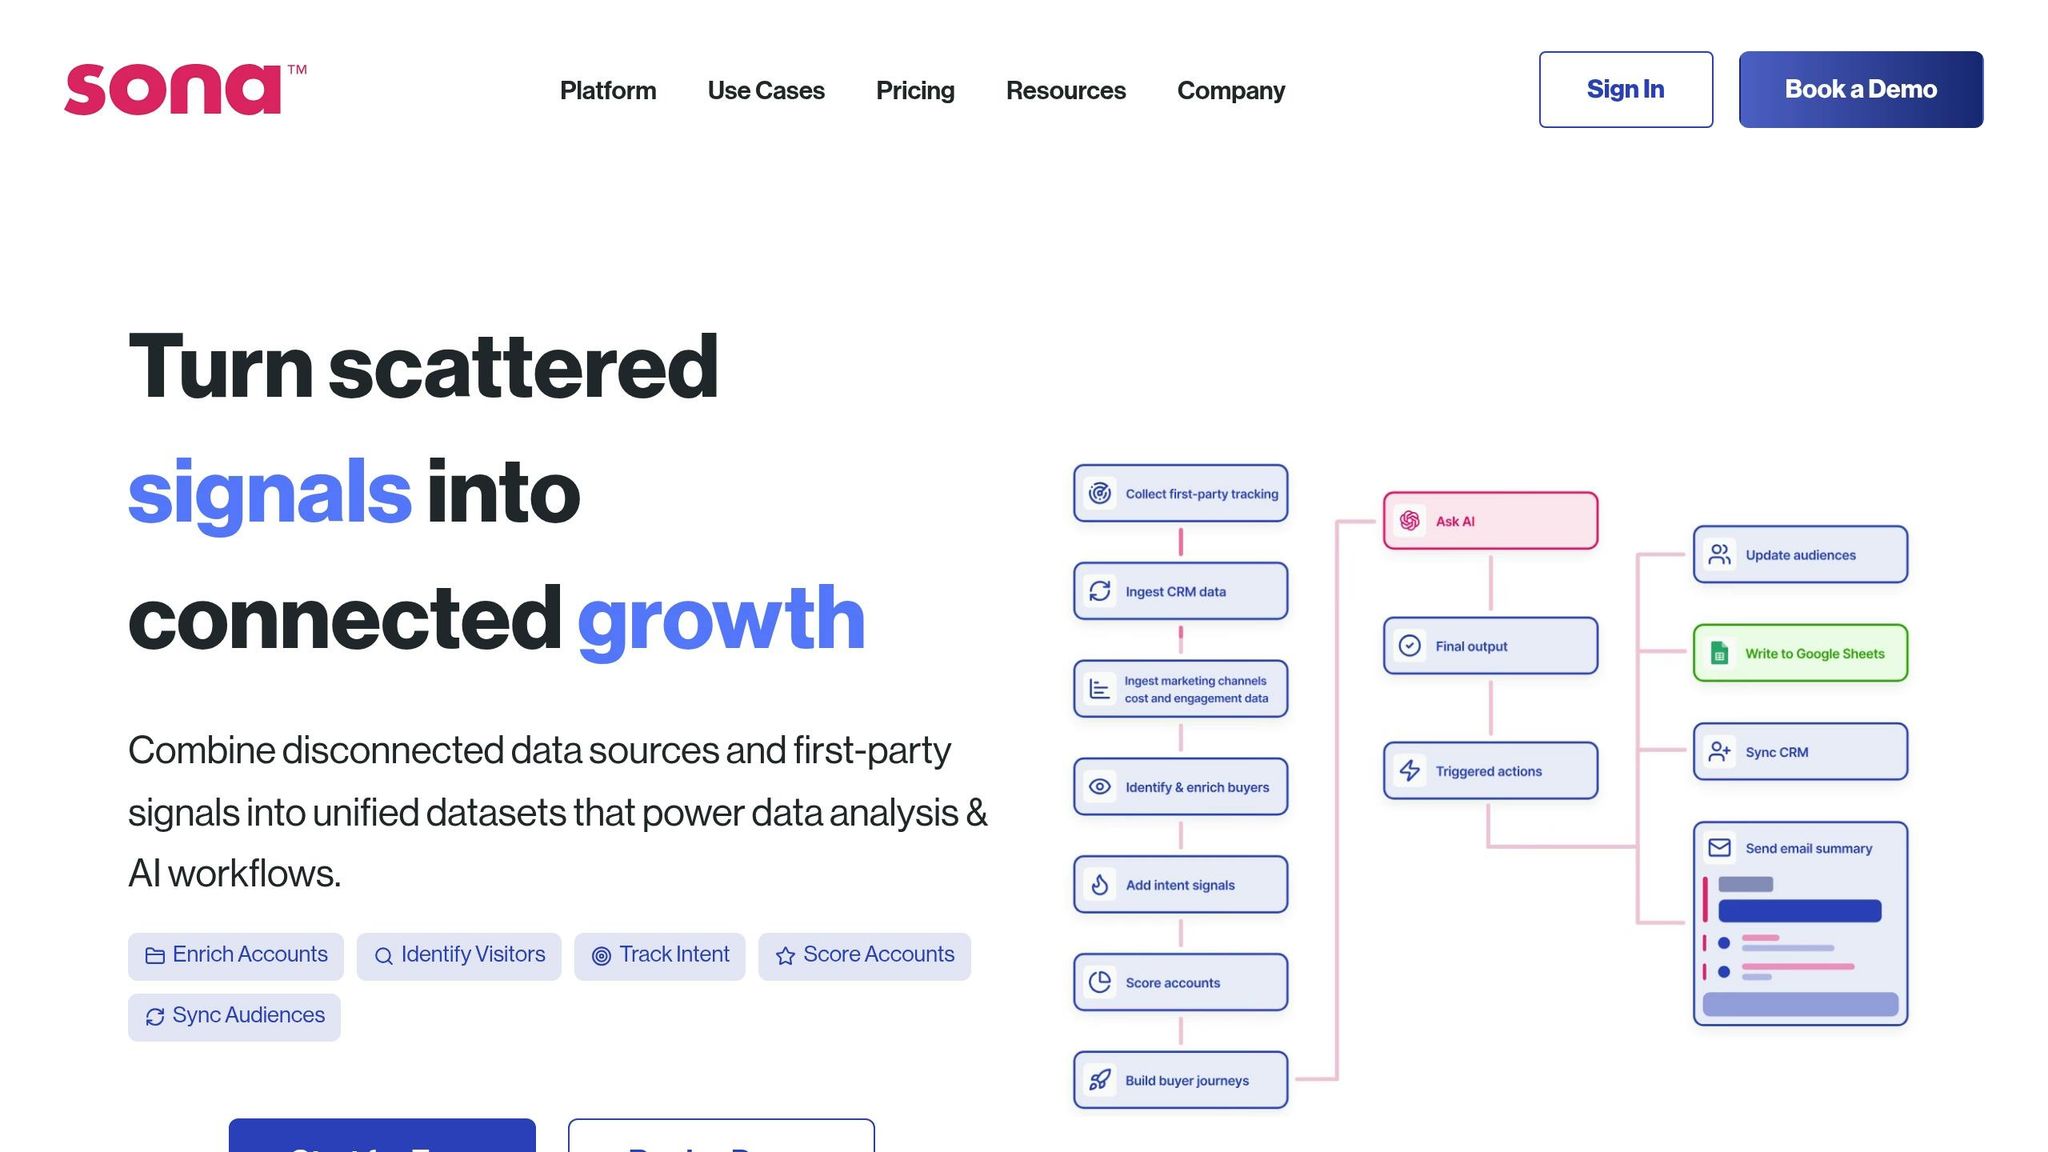
Attribution can be one of the trickiest challenges in B2B marketing, especially with long sales cycles and multiple touchpoints. Sona tackles this by connecting every interaction to revenue, integrating seamlessly with Salesforce and HubSpot. It maps touchpoints to metrics like monthly recurring revenue (MRR) and even identifies anonymous high-intent visitors before they submit a form [1].
"The Sona Revenue Growth Platform has been instrumental in the growth of Collective. The dashboard is our source of truth for CAC and is a key tool in helping us plan our marketing strategy."
– Hooman Radfar, Co-founder and CEO, Collective [1]
Sona also offers a free trial and complimentary account enrichment for HubSpot and Salesforce users, making it a practical choice for growth-stage companies looking to demonstrate strong unit economics to investors [1].
Amplitude and Mixpanel for Behavioral Analytics
Once a user signs up, tools like Amplitude and Mixpanel come into play. These platforms focus on tracking user behavior - such as feature usage, activation milestones, and engagement trends - to reveal what drives long-term retention [10]. Amplitude employs machine learning to spotlight key engagement moments, while Mixpanel excels in account-level segmentation and A/B testing [10].
While Amplitude provides a free tier, its paid plans start at $995/month, reflecting its focus on enterprise-level needs [10]. For teams aiming to reduce churn, these tools offer the insights necessary to create predictive lead scoring models and identify accounts at risk of canceling.
Tool Category | Examples | Best For | Key Metrics Tracked |
|---|---|---|---|
Web & Conversion | GA4, Heap | Traffic & initial conversion | Sessions, Goal completions, MQLs |
Revenue/Subscription | Financial health & churn | MRR, ARR, LTV, Churn rate | |
Product/Behavioral | Amplitude, Mixpanel, Mitzu | Retention & feature adoption | Activation rate, Stickiness, Cohorts |
B2B Attribution | Sona, Dreamdata, Cometly | Multi-touch ROI | CAC, CAC Payback, Pipeline influence |
How to Implement Marketing Analytics in B2B SaaS
Marketing analytics isn’t about collecting endless data; it’s about connecting the right systems to uncover what genuinely drives revenue. Many teams struggle with disconnected tools that obscure true performance. Here’s how to create an integrated system that delivers clarity.
Connect Your Data Sources
Start by building a four-layer architecture: data collection (tools like Google Tag Manager or Segment), warehousing (BigQuery or Snowflake), transformation (dbt), and visualization (Tableau or Looker Studio) [3]. For early-stage companies, a simpler setup - using Google Tag Manager, BigQuery, dbt Core, and Looker Studio - can keep costs manageable while ensuring data accuracy [3].
Your analytics platform should sync seamlessly with your CRM, whether it’s HubSpot or Salesforce, so every marketing interaction ties back to an account record [8]. CMOs who establish this foundation see a 25% higher marketing ROI [3].
"The goal isn't more tools, but a single, connected system that reveals the truth about what drives revenue. A disjointed stack tells you conflicting stories; a unified stack tells you one true story." – Altior & Co. [3]
Before launching, implement a standardized UTM naming convention for all campaigns. Use a universal guide to ensure consistency across links, from LinkedIn ads to email newsletters. Poor data hygiene can waste up to 21% of marketing budgets [11].
Once your data is integrated, focus on defining KPIs that align with revenue growth.
Define and Monitor Key Performance Indicators (KPIs)
Move away from vanity metrics like page views and concentrate on revenue-driven KPIs such as Marketing-Influenced Pipeline, Customer Acquisition Cost (CAC), and Lifetime Value (LTV) [7]. A strong B2B SaaS business should aim for an LTV:CAC ratio of at least 3:1, with top performers reaching 4:1 or higher [6].
Ensure alignment across marketing, sales, and customer success teams by agreeing on shared definitions for lead stages (MQL, SQL, and PQL) [11]. Create role-specific dashboards: founders need high-level overviews, while marketing teams benefit from detailed, channel-specific insights. Limit each dashboard to 5–7 core KPIs directly tied to business goals [4].
"Without a solid analytics foundation, your reporting can be unreliable or even nonexistent. Basics like integrations, lifecycle stage definitions, and a documented sales process have to be in place; otherwise, every number downstream is suspect." – Kara Wild, Senior Growth Marketing Manager [11]
In 2025, SaaSHero helped TripMaster achieve $504,758 in Net New ARR by adopting a revenue-focused measurement framework [8]. Similarly, TestGorilla reduced their CAC payback period to just 80 days by optimizing their analytics stack to connect marketing touchpoints directly to revenue [8].
With clear KPIs in place, the next step is setting up attribution models.
Set Up Attribution Models
Attribution models link every marketing touchpoint to revenue. Before choosing a model, ensure your data is clean and integrated. Standardize UTM parameters across campaigns and maintain accurate CRM data to avoid "garbage-in, garbage-out" scenarios [11]. Integrate web analytics (GA4), CRM platforms (Salesforce or HubSpot), ad platforms (LinkedIn, Google Ads), and product analytics into a unified system [9].
Select an attribution model that reflects your sales cycle. For example:
Linear or U-Shaped models work well for most B2B scenarios.
W-Shaped models are ideal for longer, more complex sales cycles with clear marketing-to-sales handoffs [7].
In GA4, you can enable "Data-driven attribution", which uses machine learning to assign credit based on historical performance [9]. Teams that connect GA4 with Google Ads have reported a 23% increase in conversions and a 10% drop in cost per conversion [9].
Attribution Model | How It Works | Best For |
|---|---|---|
First-Touch | 100% credit to the first interaction | Tracking early awareness campaigns [7] |
Last-Touch | 100% credit to the final interaction | Identifying closing channels [7] |
Linear | Equal credit to every touchpoint | Recognizing all journey interactions [7] |
U-Shaped | 40% to first touch, 40% to lead conversion, 20% split | Balancing awareness and lead generation [7] |
W-Shaped | 30% to first touch, 30% to lead creation, 30% to opportunity | Complex sales cycles with clear handoffs [7] |
Data-Driven | Algorithmic credit based on historical impact | High-volume teams seeking precision [9] |
Use model comparison reports to identify undervalued channels, especially at the top of the funnel [9]. Attribution should link directly to subscription events like MRR and ARR, not just proxy metrics like form fills [1].
Build Real-Time Dashboards
Dashboards should focus on actionable metrics like campaign performance, lead scoring, and cross-channel data. Keep them simple by spotlighting 5–7 KPIs that align with current business priorities [4]. For example, if churn reduction is a goal, include metrics like cohort retention rates and feature adoption.
Map the entire customer journey with multi-touch attribution to understand how top-of-funnel content influences long-term conversions [7]. Track activation rates by identifying in-app actions that correlate with retention [6]. Teams with a unified customer view are 1.7x more likely to outperform their peers [7].
Regularly validate and clean your data to maintain reporting accuracy [11]. Even minor inconsistencies, like misaligned lead source definitions, can lead to hours of manual cleanup. Document changes to KPI definitions to preserve historical comparisons [11].
Review and Optimize Your Campaigns
With your data and attribution frameworks in place, continuously refine campaigns to address performance gaps. Establish a consistent review process - weekly or monthly - to analyze trends, identify friction points, and adjust budgets based on real-time insights [4]. Use the "One Metric That Matters" (OMTM) approach to focus on improving a single key metric, like MQL-to-SQL conversion or CAC payback period [7]. Conversion rates below 15–20% often signal misalignment between sales and marketing teams [3].
Pay attention to churn indicators such as declining engagement or stalled feature adoption. Predictive lead scoring can help pinpoint accounts likely to convert - or churn [8]. Ignoring data-driven insights can waste up to 21 cents of every marketing dollar [7]. By regularly reviewing your data and acting on it, you can move from guesswork to decisions that drive results.
Conclusion
After diving into the key metrics, tools, and actionable steps, it’s clear that marketing analytics is more than just tracking numbers - it’s about creating a system that pinpoints what truly drives revenue. By doing so, businesses can avoid wasting up to 21% of their budgets and achieve up to 25% higher ROI [3][7].
To get started, focus on the basics: evaluate your current data sources, connect your CRM with your analytics tools, and establish revenue-driven KPIs like the LTV:CAC ratio and Net Revenue Retention. Shifting from vanity metrics to these meaningful indicators can lead to a 63% boost in productivity [5]. For instance, in 2025, TripMaster adopted a revenue-focused framework and saw $504,758 in Net New ARR within just one year [8].
Address data gaps, define clear KPIs, automate data processes, and consistently refine your approach. Dedicate weekly attention to your "One Metric That Matters" [3][7]. Whether your priority is improving MQL-to-SQL conversion rates or cutting churn, zeroing in on a single critical metric can deliver substantial outcomes. This disciplined approach transforms raw data into a powerful tool for driving revenue growth.
With customer acquisition costs soaring by 180% and privacy regulations becoming stricter by 2026, precision in analytics is no longer optional [8]. Laying the groundwork now for a robust analytics strategy will help you move away from guesswork and scale your business with confidence.
FAQs
What should I track first if my data is messy?
Start with a focus on data quality and consistency. Address core issues by standardizing definitions, integrating systems to break down data silos, and ensuring the data is accurate and clean. Once your data is dependable, shift your attention to tracking critical metrics that directly impact performance - think customer acquisition costs, churn rates, and lead sources. Building a reliable data foundation is crucial for making informed, impactful decisions based on real insights.
Which attribution model works best for a long B2B sales cycle?
A multi-touch attribution model works well for a lengthy B2B sales cycle because it evaluates the impact of multiple touchpoints throughout the extended decision-making journey. This method provides a clearer picture of how different interactions collectively influence conversions.
How do I tie marketing activity to ARR and churn?
To link marketing efforts directly to Annual Recurring Revenue (ARR) and churn rates, focus on tracking key metrics such as customer acquisition costs, lead quality, conversion rates, and churn trends. Dive into how leads generated through marketing evolve into paying customers and contribute to overall revenue. Leverage analytics tools to measure the impact of campaigns on both revenue growth and customer retention. This approach provides clear insights into which marketing activities boost ARR and help minimize churn, enabling informed decisions that drive sustainable growth.
Related Blog Posts

Zach Chmael
CMO, Averi
"We built Averi around the exact workflow we've used to scale our web traffic over 6000% in the last 6 months."
Your content should be working harder.
Averi's content engine builds Google entity authority, drives AI citations, and scales your visibility so you can get more customers.