In This Article
Marketing analytics turns raw app data into predictable growth by improving acquisition, retention, and monetization.
Updated:
Trusted by 1,000+ teams
Startups use Averi to build
content engines that rank.
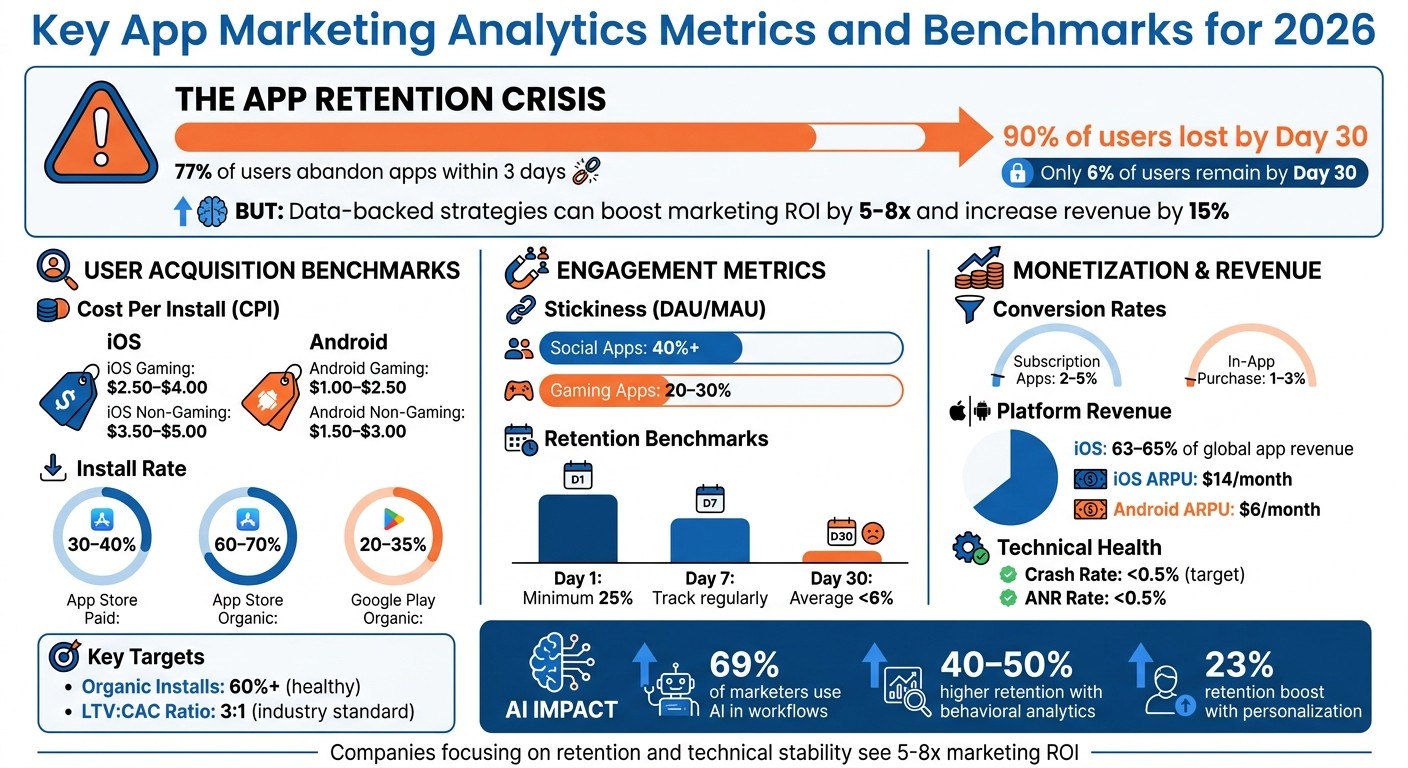
Marketing analytics is the key to growing consumer apps in 2026. Apps lose 77% of daily users within three days, and 90% by Day 30. But data-backed strategies can reverse this, boosting marketing ROI by 5–8x and increasing revenue by 15%. Here's how you can use analytics to improve user acquisition, retention, and monetization:
Track the Right Metrics: Focus on Cost Per Install (CPI), retention rates (Day 1, 7, 30), stickiness (DAU/MAU), and Lifetime Value (LTV) versus Customer Acquisition Cost (CAC).
Choose Effective Tools: Start with Google Analytics 4 (GA4) for basic tracking, Amplitude or Mixpanel for behavior insights, and AppsFlyer or Adjust for install source tracking.
Set Clear Goals: Define your app's "North Star Metric" (e.g., "first session completed") to align tracking with business objectives.
Segment and Personalize: Use behavioral data to group users and tailor messaging, boosting retention by up to 23%.
Leverage AI: Predict churn, optimize ad creatives, and automate workflows for better results.
Key App Marketing Analytics Metrics and Benchmarks for 2026
Setting Up Marketing Analytics for Your App
Choosing the Right Analytics Tools
When it comes to consumer app analytics, there are three key components to focus on: Attribution (understanding where your users come from), Product/Behavioral (analyzing user activity within your app), and Creative Performance (identifying which ad elements drive sustained engagement and value) [2]. The tools you choose should address the specific challenges limiting your app's growth.
Start by building a solid foundation with Google Analytics 4 (GA4) through Firebase. It’s free for up to 500 distinct event types and integrates seamlessly with Google Ads, making it a great starting point [2][3]. For more advanced behavioral insights, Amplitude (starting at $995/month) offers powerful cohort analysis and churn prediction tools, while Mixpanel provides an intuitive platform for funnel reporting with a free tier that includes 1 million monthly events [2][3]. To track install sources and aggregate cost data, consider using a Mobile Measurement Partner like AppsFlyer or Adjust [2].
Why invest in behavioral analytics? Companies that leverage these tools experience 40–50% higher user retention compared to those relying on basic metrics like download counts [3]. The key difference lies in tracking meaningful user actions, such as "song_completed", instead of focusing solely on technical clicks [3].
Tool Category | Primary Use Case | Recommended Platforms |
|---|---|---|
Foundational | Basic event tracking & Google ecosystem integration | GA4 (Firebase), Flurry |
Product/Behavioral | Funnel optimization, retention, & A/B testing | Amplitude, Mixpanel |
Attribution (MMP) | Tracking install sources and cost aggregation | AppsFlyer, Adjust, Branch |
Technical Health | Crash reporting and performance monitoring | Firebase Crashlytics, Sentry |
With the right tools in place, you’ll be equipped to gather actionable insights that can improve acquisition, retention, and monetization. The next step is to ensure your event tracking is configured to capture the most critical user behaviors.
Configuring Event Tracking
Before diving into SDK installation, define your North Star Metric - the single measure that best reflects the value your app delivers [4]. For example, a meditation app might use "completed first session", while a finance app could focus on "linked first bank account."
Integrating the SDK typically takes about 30 minutes [4]. Start by tracking 10–15 core events that align with specific business questions. Avoid overloading your system with unnecessary data, as this can create noise and slow down your analytics [3].
Focus on activation events - those "aha moments" where users realize your app’s value. These moments are strong predictors of long-term retention. Always segment retention data by factors like install date or acquisition channel, as aggregate metrics can obscure trends in newer user groups [3][4].
Effective event tracking is only as good as the data it produces. That’s where strong data management practices come into play.
Ensuring Data Accuracy
To maintain data reliability, create a clear event taxonomy with intent-based names. For instance, use "purchase_completed" instead of "payment_button_tapped." Conduct code reviews before deploying new events to catch errors early [3].
For teams ready to dive deeper, linking GA4 data to BigQuery allows for custom analyses and integration with other internal data sources [2]. Keep in mind that GA4 data may have a lag of up to 48 hours [3].
Pay attention to technical stability, as it directly impacts user retention and app store rankings. Aim for a crash rate below 0.5%, and monitor it as a key product metric [4]. Additionally, healthy apps often achieve at least 60% organic installs. If more than 90% of your users come from paid channels, it could indicate weak growth fundamentals [4].
Top Mobile App Analytics Tools
Key Metrics to Monitor for App Growth
Once you've set up your analytics, it’s time to focus on metrics that genuinely drive growth. Forget about total downloads - what really matters is actionable data that reveals user behavior and highlights revenue opportunities. These metrics are essential not just for tracking performance but also for feeding AI models that can predict trends and improve workflows. Let’s break it down into three critical areas: acquisition, engagement, and monetization.
User Acquisition Metrics
Cost Per Install (CPI) shows how much you’re spending to get a user to download your app. For iOS gaming apps, the global benchmark is $2.50–$4.00, while iOS non-gaming apps range from $3.50–$5.00. On Android, gaming apps typically cost $1.00–$2.50 per install, and non-gaming apps range between $1.50 and $3.00. Keep in mind, these figures vary significantly based on region and category, so always compare your CPI to benchmarks specific to your app type [4].
Install Rate reflects the percentage of users who visit your app store page and actually download the app. Paid campaigns on the App Store typically convert at 30–40%, organic listings at 60–70%, while Google Play organic listings fall between 20–35% [4]. If your numbers are lagging, it’s time to revisit your app store listing - optimize screenshots, descriptions, and reviews before investing more in ads.
The Organic vs. Paid Split helps you evaluate the balance between organic and paid installs. A healthy app should aim for at least 60% organic installs over time [4]. If over 90% of your installs are paid, your growth is fragile - relying too heavily on paid channels means you’re constantly paying for user acquisition without building sustainable, discovery-driven growth.
LTV:CAC Ratio compares the lifetime value of a user (LTV) to the cost of acquiring them (CAC). The industry standard is 3:1, meaning you should earn $3 for every $1 spent on acquisition [4]. If your ratio is below 1:1, you’re losing money with each user. On the flip side, a ratio above 5:1 indicates you might not be investing enough in growth.
While acquiring users is critical, understanding how they interact with your app is just as important.
Engagement and Retention Metrics
Day 1, Day 7, and Day 30 Retention rates track how many users return after their first install. If your Day 1 retention is below 25%, it could mean your onboarding process is flawed or your marketing promises don’t match the app experience [4]. Low Day 7 retention suggests your app isn’t fostering regular use, and poor Day 30 retention indicates a lack of long-term engagement. On average, apps retain fewer than 6% of users by Day 30 [4], and 77% of users abandon apps within the first three days.
Stickiness measures how engaged users are by calculating (Daily Active Users ÷ Monthly Active Users) × 100. Social apps should aim for 40%+ stickiness, while gaming apps typically fall in the 20–30% range [3][4]. A decline in stickiness is a clear warning sign that your app is losing its appeal. Focus on tracking meaningful actions - like “song completed” for a music app or “task created” for a productivity tool - instead of just app opens. Shifting from vanity metrics to behavioral ones is key to sustained growth.
Monetization Metrics
Once you’ve nailed user acquisition and engagement, the next step is turning those insights into revenue.
Average Revenue Per User (ARPU) looks at revenue across your entire user base, while Average Revenue Per Paying User (ARPPU) focuses only on those who make purchases [4]. Comparing the two can help pinpoint whether your revenue issues stem from low pricing (low ARPPU) or poor conversion rates (low ARPU despite high ARPPU).
Lifetime Value (LTV) estimates the total revenue a user generates throughout their relationship with your app. This metric is crucial for determining how much you can afford to spend on acquiring users [5][4]. You can calculate it by dividing ARPU by the monthly churn rate.
Conversion Rate (Free-to-Paid) tracks how many users transition from free usage to a paid tier or make an in-app purchase. Subscription-based apps typically see conversion rates of 2–5%, while in-app purchase models average 1–3% [4]. Even small improvements here - like increasing a conversion rate from 4% to 6% - can lead to significant revenue growth.
While Android dominates market share, iOS users account for 63–65% of global app revenue [6]. On average, iOS users spend $14 per month, compared to $6 per month for Android users [6]. If revenue is your top priority, focusing on iOS first might be the smarter move.
Analyzing User Behavior and Segments
Understanding how users interact with your product and segmenting them based on their behaviors can provide actionable insights. These insights are the foundation for making informed decisions in areas like user acquisition, engagement strategies, and monetization efforts.
Understanding User Behavior Patterns
Funnel analysis helps track users as they move through specific steps - like onboarding or checkout - and identifies where they drop off [1][3]. For example, if a significant number of users abandon the process at a particular onboarding step, it’s a clear signal to investigate that area further. Tools like Smartlook allow you to replay user sessions, offering a firsthand look at interactions. These replays can uncover issues such as confusing instructions or poorly designed buttons [1].
Focusing on intent-based events can also highlight which actions contribute most to lifetime value. Companies that integrate behavioral analytics report 40–50% higher retention rates compared to those relying solely on basic metrics [3].
This type of analysis sets the stage for grouping users by behavior, paving the way for more tailored engagement strategies.
Segmenting Users for Personalization
Not all users interact with your app in the same way. Behavioral segmentation divides users based on their actions within the app - for example, distinguishing between power users and casual browsers or identifying those who completed onboarding versus those who didn’t [1][3]. Adding custom attributes like device type, subscription level, or acquisition channel allows for even more precise targeting [1].
Apps combining tools like Firebase and Amplitude have reported a 23% boost in retention within the first 90 days [1]. Comparing retention rates across acquisition sources also reveals valuable patterns - for instance, organic users often show better retention than those acquired through paid campaigns [3]. Moreover, companies using predictive analytics to identify high-value segments typically see a 15% increase in revenue [1].
Once users are segmented, cohort analysis can further illuminate retention patterns over time.
Using Cohort Analysis for Retention
Cohort analysis groups users by shared traits - such as their signup date or the action that brought them to your app - and tracks how their behavior evolves over time [1][3]. Acquisition cohorts help identify when users drop off, while behavioral cohorts focus on uncovering the reasons behind their disengagement [8][9]. Analyzing early user actions can reveal how initial engagement impacts long-term retention.
"Segmentation is the single most impactful thing product teams can do to improve their onboarding experience. And the only way to know that changes in the user onboarding are working is through cohort analysis." - Ramli John, Founder, Delight Path [7]
Using AI to Optimize Marketing Analytics
AI is transforming how marketers approach analytics, shifting from traditional reporting to forward-thinking, proactive strategies. Instead of just reviewing past data, AI tools can predict user behavior, pinpoint the most effective ad elements, and automate optimization tasks. Currently, 69% of marketers incorporate AI into their workflows [10].
Let’s dive into how AI tools help identify at-risk users and fine-tune conversion strategies.
Predictive Analytics for Churn and Conversions
AI-powered predictive analytics can analyze user behavior patterns to forecast future actions and identify those likely to churn [1]. This enables marketers to engage proactively with at-risk users through targeted offers, personalized notifications, or tailored support aimed at boosting retention [1]. Considering 77% of users abandon an app within the first three days of downloading it, and only 6% of users stick around by Day 30, these interventions are essential [4].
Platforms like Segwise take this further by using multimodal AI to evaluate ad creative elements - such as video hooks, audio, and text - to determine which components are most effective in reducing churn and driving long-term engagement [2]. For instance, the platform might reveal that a specific music choice or visual cue in an ad correlates with higher retention rates. Businesses using predictive analytics report an average 15% boost in revenue [1].
To maximize the effectiveness of churn prediction models, ensure technical stability by minimizing app crashes and ANR (Application Not Responding) rates [4]. These models can also trigger automated "win-back" campaigns for users flagged as likely to leave [1].
A/B Testing with AI Tools
AI is also revolutionizing A/B testing, with platforms like Amplitude and Mixpanel leading the way. These tools integrate experimentation and behavioral cohort analysis to evaluate the impact of product changes [2]. Amplitude excels in deep behavioral analysis and experimentation, while Mixpanel is known for its user-friendly interface and real-time event tracking [2]. Both platforms offer free tiers - Amplitude supports up to 50,000 Monthly Tracked Users (MTUs), while Mixpanel’s free tier covers up to 1 million monthly events [2].
Mixpanel's Spark AI simplifies complex queries by allowing marketers to ask plain-language questions like, "Which users who signed up in March are still active?" and receive instant insights [2]. Additionally, AI-driven fatigue detection algorithms notify marketers when ad creatives lose their effectiveness, helping to avoid wasted spending and user irritation [2].
AI doesn’t stop at testing - it integrates seamlessly with existing tools to streamline workflows and enhance efficiency.
Automating Recommendations and Workflows
AI-powered workflows are now directly connecting to marketing tools to automate repetitive tasks and deliver tailored recommendations. No-code platforms such as Gumloop and Zapier let marketing teams create custom AI workflows that link large language models (LLMs) to CRMs like Slack, Salesforce, or HubSpot without requiring developer expertise [11][12].
Dynamic Creative Optimization (DCO) is another game-changer, generating thousands of personalized ad variations in seconds based on product feeds. This is especially critical for e-commerce and retail apps aiming to engage users effectively [2]. For businesses spending over $50,000 per month on ads, creative intelligence tools ensure that acquisition campaigns attract users with higher retention potential [2]. Meanwhile, tools like Seventh Sense analyze recipient behavior to send emails at the exact moment they’re most likely to interact with them [11].
"The future belongs to marketing teams that find the right balance: Use AI for data analysis and pattern recognition, and apply human intelligence for strategy and empathy." - Solsten Staff [10]
Optimizing Acquisition, Retention, and Monetization
With analytics set up and AI workflows humming, it's time to fine-tune your strategies for acquiring, retaining, and monetizing users. These three pillars of growth - acquisition, retention, and monetization - are most effective when optimized together. By building on the insights from your analytics, you can turn data into measurable revenue growth.
Refining User Acquisition Strategies
Success in user acquisition isn’t about chasing the lowest Cost Per Install (CPI). Instead, it’s about finding channels that bring in users who stay engaged and spend. Tools like AppsFlyer and Adjust, known as Mobile Measurement Partners (MMPs), can track installs back to specific campaigns, helping identify which channels, creatives, and publishers deliver the best Return on Ad Spend (ROAS) [13][14]. This precision is increasingly important as acquisition costs rise [15].
Multi-touch attribution models, such as linear or time-decay, can help you allocate credit across the entire user journey, uncovering undervalued channels that contribute earlier in the funnel [16]. Keep an eye on your LTV:CAC ratio - successful apps generally maintain a 3:1 ratio [16].
Creative intelligence tools like Segwise analyze ad components - video hooks, audio, visuals - to identify what drives the highest ROAS across platforms [2]. With privacy regulations making behavioral targeting less effective, creative content has become a key focus. Incrementality testing, using control groups, ensures your ad spend generates new users rather than cannibalizing organic traffic [16].
In July 2022, Vivino, a wine marketplace, used Adjust to segment users and deliver personalized wine recommendations based on past ratings. This strategy led to a 500% increase in performance channel orders [22].
Once you’ve attracted quality users, the next step is keeping them engaged.
Boosting Retention Through Personalization
Retention begins with understanding user behavior. Segment users by activity level - such as power users, at-risk users, or casual users - to tailor re-engagement strategies [18][20]. Early retention is critical, as 77% of users abandon an app within the first three days [4].
Identify your app’s "aha moment" - the instant users experience its core value - and streamline their journey to reach it [4][20]. Progressive onboarding, where features are introduced gradually as users engage, can prevent overwhelming new users [18][19]. Technical reliability is just as important; aim for crash rates below 1% and Application Not Responding (ANR) rates under 0.5% to minimize early churn [4].
Predictive churn analysis can identify users at risk of dropping off by tracking changes in login frequency or session duration. Automated re-engagement campaigns can then be triggered to bring them back [18][21]. Segmented push notifications, timed to individual user behavior, achieve a 54% conversion rate compared to generic messages [17][24].
In 2025, Headspace teamed up with Phiture to use Braze for cross-channel lifecycle messaging based on user intent. This approach boosted Week 1 retention by 109% and increased new user activation by 26% [20].
Maximizing Revenue with Data-Driven Monetization
Predictive LTV modeling can forecast the value of users, helping you prioritize high-value segments [1]. Companies using predictive analytics report an average 15% revenue lift [1]. Segment users - such as high spenders, inactive users, or repeat customers - and tailor offers and in-app messaging to their behaviors [24].
AI-powered personalized recommendations can drive engagement and conversions by suggesting content or products based on user history [22][2]. For subscription-based apps, consider offering flexible "pause" or "skip" options to retain users who might otherwise cancel [23]. Gamification tactics like streaks, badges, and leaderboards can also encourage repeat transactions and build long-term habits [24].
Analyzing your conversion funnel can reveal where users drop off during onboarding or purchases, allowing you to reduce friction at those points [1][25]. Metrics like ARPU (Average Revenue Per User) and ROAS can help you track overall monetization performance and measure the impact of your ad spend [25].
In November 2025, Snoonu, a Qatari delivery app, introduced a gamified "Spin the Wheel" feature for its Snoomart grocery service. Customers who placed orders over 70 QAR received instant prizes, leading to a 32% revenue increase and a 39% rise in orders within 30 days [23].
Similarly, Poshmark launched a "Listing Streak" challenge using MoEngage to track seller activity, boosting conversions by 30% through personalized email and push campaigns with countdown timers [24].
Conclusion
Marketing analytics is the backbone of every successful app's growth strategy. It ties together everything - starting from the first ad click to in-app user behavior and back to refining creative campaigns. This data-driven approach eliminates guesswork, ensuring you know exactly where users drop off and which channels provide the most value [2]. Without it, you're essentially navigating without a map.
The apps that thrive focus on two key pillars: user retention and technical stability. Without these, even the largest acquisition budgets and flashy campaigns won’t deliver meaningful results. A well-constructed analytics stack - combining attribution, behavioral insights, and creative performance tracking - gives you the clarity to address problems before they escalate [2]. This focus on retention naturally ties into keeping your app technically sound.
Technical stability is non-negotiable. If your app has a crash rate over 2% or load times longer than 3 seconds, no amount of marketing can save it [4]. Companies that emphasize clean, reliable data and track critical metrics - like maintaining a lifetime value (LTV) to customer acquisition cost (CAC) ratio between 3:1 and 5:1 - experience a 5–8x return on their marketing investments [1][4].
"Without app analytics, you are flying a plane with no instruments. You might feel like you are climbing, but you could be in a slow descent toward the ground." - Aasif Khan, Author [4]
Shifting focus from surface-level metrics to actionable KPIs is what sets growing apps apart. Metrics like DAU/MAU stickiness ratios and cohort-based retention provide the insights needed to fuel long-term success. By connecting creative performance to user value, leveraging AI for real-time insights, and automating workflows, you can optimize your budget allocation and deliver personalized experiences faster. This approach transforms raw data into consistent, predictable revenue growth [2][4].
FAQs
What’s the fastest way to pick a North Star Metric for my app?
To pick a North Star Metric quickly, start by focusing on the metric that directly supports your app's main business objective - whether that's engagement, retention, or revenue. Leverage analytics tools to dig into user behavior and pinpoint a metric that serves as a reliable indicator of long-term success, such as Daily Active Users (DAU), Monthly Active Users (MAU), or Lifetime Value (LTV). Then, run a quick trend or cohort analysis to confirm that the chosen metric truly represents your app’s value and its potential for growth.
What 10–15 events should I track first to avoid noisy analytics?
To cut down on unnecessary noise in your analytics, it’s essential to focus on tracking events that genuinely shed light on user behavior. Start by prioritizing these key areas:
User acquisition: Metrics like installs and sign-ups help you understand how users are entering your ecosystem.
Onboarding completion: Tracking this reveals how effectively users are getting started with your product.
Core feature interactions: Monitor how users engage with the main features of your app to gauge its value.
Retention metrics: Keep tabs on retention at critical intervals such as Day 1, Day 7, and Day 30 to identify trends in user loyalty.
In-app purchases: These provide insight into monetization and user spending behavior.
Technical performance: Metrics like app crashes highlight areas that may need technical improvements.
Conversion events: Understand how users move through your funnels and achieve desired outcomes.
Engagement metrics: Data like session length shows how actively users are engaging with your app.
By focusing on these specific events, you’ll gather meaningful data that leads to actionable insights without being overwhelmed by irrelevant information.
How do I connect LTV to CAC to decide if my ad spend is worth it?
To assess whether your advertising investment is paying off, use the LTV:CAC ratio. This involves dividing your Customer Lifetime Value (LTV) by your Customer Acquisition Cost (CAC). A solid benchmark is a ratio of 3:1 or higher, indicating that for every $1 spent, you generate $3 in return. If your ratio falls short of this, it might be time to refine your marketing strategies or focus on enhancing customer retention to increase overall profitability.
Related Blog Posts

Zach Chmael
CMO, Averi
"We built Averi around the exact workflow we've used to scale our web traffic over 6000% in the last 6 months."
Your content should be working harder.
Averi's content engine builds Google entity authority, drives AI citations, and scales your visibility so you can get more customers.