In This Article
Unify ecommerce data, adopt multi-touch attribution, and use AI to improve CAC, ROAS, AOV, and CLV.
Updated:
Trusted by 1,000+ teams
Startups use Averi to build
content engines that rank.
Marketing analytics can transform how ecommerce brands turn data into revenue. By integrating data, improving attribution, and focusing on profitability metrics, you can eliminate waste and make smarter decisions.
Here’s what you need to know:
Unify your data: Combine platforms like Shopify, Google Analytics, and ad tools into one system for accurate insights.
Focus on key metrics: Track Customer Acquisition Cost (CAC), Return on Ad Spend (ROAS), Average Order Value (AOV), and Customer Lifetime Value (CLV).
Adopt better attribution: Move beyond last-click models to multi-touch and incrementality testing for a clearer picture of what drives sales.
Leverage AI tools: Platforms like Averi AI automate insights, flag inefficiencies, and recommend actions to boost performance.
4-Step Marketing Analytics Framework for Ecommerce Success
Ecommerce Marketing Analytics: A Beginner's Guide to Data-Driven Success
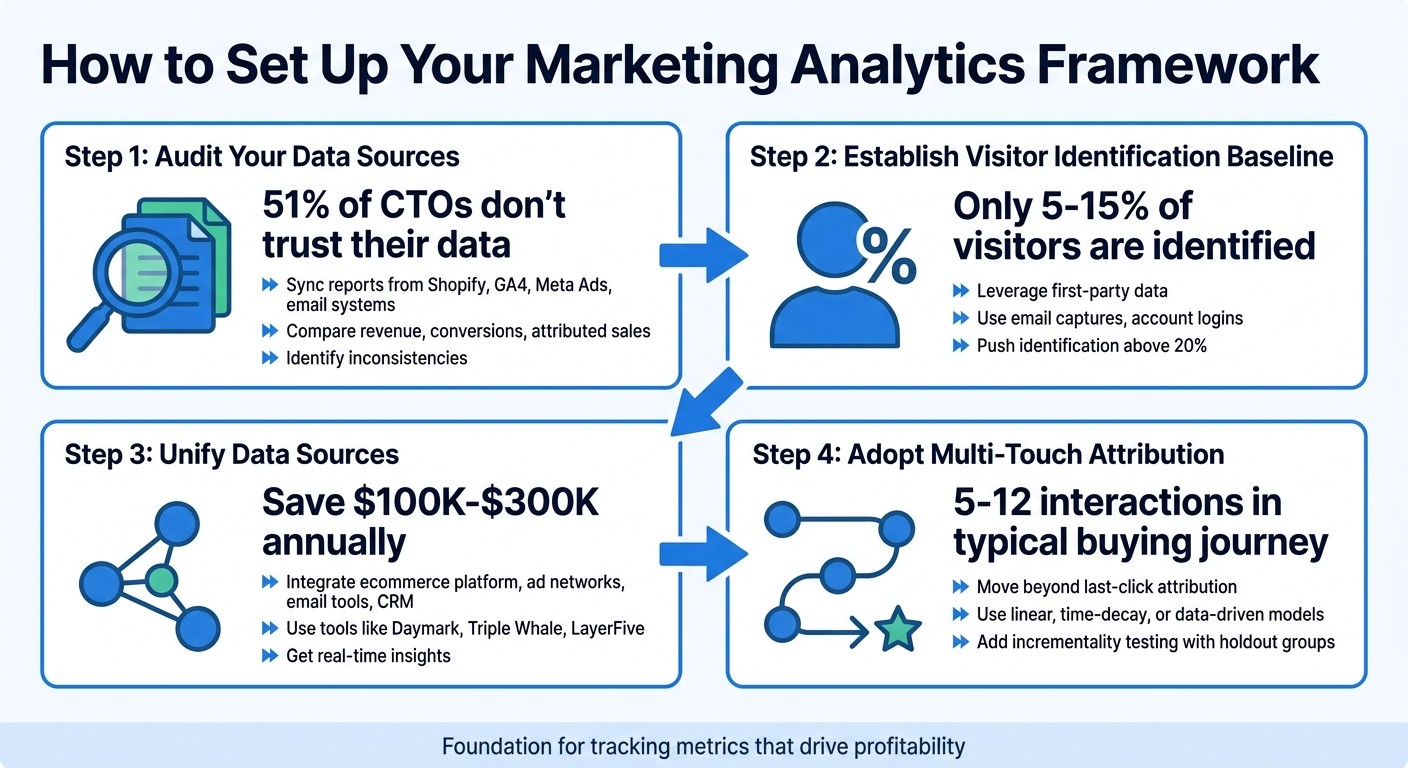
How to Set Up Your Marketing Analytics Framework
Start by auditing your data sources to ensure accuracy and build confidence in the numbers. Most ecommerce brands juggle between 17 and 20 marketing platforms, yet 51% of CTOs and chief data officers don't trust the data they receive from these systems [3]. To address this, gather synchronized reports from platforms like Shopify, GA4, Meta Ads Manager, and your email system. Compare metrics such as total revenue, conversion counts, and attributed sales to identify inconsistencies. Pinpointing these gaps is the first step in creating reliable data.
Next, establish a clear baseline for visitor identification. Right now, only 5–15% of visitors are identified, leaving most paid traffic anonymous [3]. To improve this, leverage first-party data through email captures, account logins, or consented tracking. These efforts can push identification rates above 20%, enabling better attribution and more effective retargeting.
Once you’ve set a baseline, unify all your data sources into a single, consistent layer. Integrate your ecommerce platform, ad networks (like Meta, Google, and TikTok), email tools such as Klaviyo, and your CRM into one system. Consolidating fragmented data stacks can save brands $100,000 to $300,000 annually while providing real-time insights [3][4]. Tools like Daymark, Triple Whale, or LayerFive simplify this process, pulling data from multiple sources without requiring engineering expertise.
Finally, adopt an attribution model that reflects the complexity of customer journeys. Relying on last-click attribution can be misleading since it credits only the final touchpoint - often branded search or retargeting ads - while ignoring earlier interactions. Multi-touch models, such as linear, time-decay, or data-driven approaches, distribute credit across the 5 to 12 interactions typical in modern buying journeys [4]. Complement this with incrementality testing using holdout groups to measure the true impact of each channel, beyond platform-reported ROAS [3][5].
With these steps in place, you’ll have a solid foundation for identifying the metrics that truly drive profitability.
Track Your Key Performance Metrics
Not every metric deserves your attention. Metrics like impressions, reach, and click-through rates may look impressive, but they don’t directly impact your bottom line. Instead, focus on four metrics that tie directly to profitability: Customer Acquisition Cost (CAC), Return on Ad Spend (ROAS), Average Order Value (AOV), and Customer Lifetime Value (CLV).
CAC: This metric shows how much it costs to acquire a new customer. If your CAC is $45 but your average order only generates $30 in profit, your strategy isn’t sustainable. CAC helps determine whether a channel is viable at your current margins.
ROAS: This measures revenue generated per dollar spent on ads. For example, spending $1,000 and earning $3,000 in sales results in a 3:1 ROAS. While useful for short-term budget decisions, it doesn’t account for returns, refunds, or repeat purchases.
AOV: The average value of a single order. If your AOV is $85, you can use this to set free-shipping thresholds, create bundling strategies, or develop upsell opportunities.
CLV: The total revenue a customer generates over their lifetime relationship with your brand. For instance, a one-time $50 purchase results in a CLV of $50, but a customer who spends $50 four times over two years has a CLV of $200. Channels that attract repeat buyers, like email or loyalty programs, justify higher CAC.
"You don't live on clicks and impressions. You live on contribution margin, inventory turns, cash flow, and lifetime value." - Frevana Merchant's Guide [5]
Track these metrics regularly - daily or weekly - broken down by channel, campaign, and product category. Brands that enhance tracking accuracy using first-party data have reported a 20% ROAS increase on platforms like Meta and Google [3]. The key is moving beyond surface-level metrics to focus on profitability and cash flow.
Connect Your Data Sources for Complete Tracking
A unified data layer is essential for complete tracking. This involves integrating data across four key categories: paid media (Google Ads, Meta Ads, TikTok Ads), ecommerce platforms (Shopify, BigCommerce, WooCommerce), CRM and email tools (Salesforce, HubSpot, Klaviyo), and analytics tools (GA4, Mixpanel, Amplitude) [11][12].
For smaller brands, tools like Daymark (free to start) or Triple Whale (starting at $129/month) simplify this process with pre-built connectors [10]. These platforms handle data integration and ensure reports update automatically. For larger enterprises, solutions like BigQuery, Snowflake, or Redshift centralize data from hundreds of sources [1][2]. ETL/ELT tools like Improvado or Funnel streamline data collection and mapping from over 500 sources without requiring custom coding [1][11].
To combat signal loss caused by browser tracking restrictions, implement server-side tracking using Conversions API (CAPI) integrations for Meta, Google, and TikTok [4][3]. Standardize UTM parameters across campaigns to ensure accurate comparisons [1][12]. Moving beyond session-based tracking, adopt identity resolution to connect touchpoints across devices and browsers, creating a unified view of customer journeys [4][3].
In 2025–2026, Shopify brand Billy Footwear implemented LayerFive’s identity-resolved attribution system. By identifying which combinations of touchpoints - such as Facebook discovery followed by email retargeting - drove high-value customers, they achieved a 36% year-over-year increase in ad revenue with only a 7% increase in ad spend [3][4].
Use Multi-Touch Attribution Models
Last-click attribution often paints an incomplete picture by giving all credit to the final interaction before a purchase. For example, a customer might see a Facebook ad, visit your site, leave, get retargeted on Instagram, click an email, search for your brand on Google, and then convert. Last-click attribution would only credit that final Google search, ignoring the earlier steps that influenced the decision.
Multi-touch attribution (MTA) offers a more accurate approach by distributing credit across all touchpoints. For instance:
Linear attribution divides credit evenly across all interactions. If there are five touchpoints, each gets 20%.
Time-decay attribution assigns more weight to interactions closer to the purchase, acknowledging their stronger influence.
Data-driven attribution uses machine learning to analyze customer journeys and allocate credit based on statistical impact [4].
To complement MTA, use incrementality testing to measure true channel impact. By running holdout tests - where a channel is excluded for a subset of your audience - you can compare conversion rates between exposed and unexposed groups. This approach identifies what revenue is genuinely driven by marketing versus what would have occurred naturally [3][5]. Schedule these tests monthly or quarterly to refine your budget allocation based on what truly drives performance [3].
How Customer Segmentation Improves Your Marketing
By unifying your data and applying segmentation, you can turn raw metrics into targeted strategies that drive revenue. Treating every customer the same wastes around 37% of marketing budgets due to poor targeting [14]. Segmentation addresses this issue by grouping customers based on behavior, value, and purchasing habits. Campaigns tailored to specific segments can boost conversions by up to 200% compared to generalized efforts [13].
"Without customer segmentation, businesses waste their resources." - Ajay Sirsi, Director at the Centre for Customer Centricity, York University [16]
Segmentation also helps identify which customers contribute most to profitability. For instance, returning customers typically spend 67% more than first-time buyers [14]. Additionally, increasing retention rates by just 5% can result in profit increases ranging from 25% to 95% [14]. Recognizing your most valuable segments allows you to focus your budget where it matters - rewarding loyal customers and re-engaging those at risk of leaving.
Segment by Customer Behavior and Value
The RFM framework - Recency, Frequency, and Monetary value - offers a practical way to group customers into actionable tiers [15].
Core Customers include "Champions" (frequent, high spenders), "Big Spenders" (high monetary value but less frequent), and "Loyalists" (consistent repeat buyers). These groups benefit from VIP rewards, early product access, and exclusive offers [15].
Potential Core Customers are "New Customers" (first-time buyers) and "Promising" (recent repeat buyers). For these groups, onboarding campaigns can build brand value and encourage repeat purchases [15].
Non-Core Customers are lower-value segments like "Lost" buyers, who typically shop only during significant promotions [15].
Beyond RFM, the Retention Spectrum helps classify customers as Active, Drifting, Churn Risk, or Lost. Drifting customers, for example, can be re-engaged with educational content and personalized recommendations, while high-risk segments may respond to time-sensitive "We Miss You" offers with strong discounts [15].
Segment Category | Characteristics | Recommended Marketing Action |
|---|---|---|
Champions | High spend, high frequency | Exclusive VIP rewards, early product access [15] |
New Customers | First-time buyers, average order value | Onboarding campaigns to build loyalty [15] |
Drifting | Declining activity but still aware | Educational content, personalized recommendations [15] |
Churn Risk | Long time since last purchase | Targeted "We Miss You" offers, steep discounts [15] |
Low Value | One-time, low-value buyers | Automated emails, minimal manual effort [16] |
Incorporating acquisition channels into your segmentation strategy provides even deeper insights for targeted marketing.
Analyze Where Customers Come From and What They Buy
Understanding acquisition channels allows you to pinpoint where your most valuable customers originate. Metrics like CAC (Customer Acquisition Cost), ROAS (Return on Ad Spend), and CLV (Customer Lifetime Value) can reveal which platforms consistently deliver high-value customers [13].
Segmenting customers by channel, device, or behavioral triggers (like cart abandonment) enables timely, personalized offers. For instance, the average ecommerce cart abandonment rate is 77.13%, but abandoned cart emails can recover 4–5% of customers, especially for businesses with high average order values [13]. Additionally, iOS users often demonstrate higher spending power than Android users, making them an ideal segment for premium product campaigns [13].
Purchase patterns also offer valuable opportunities. For example, a customer who buys running shoes every six months should receive targeted campaigns for new models rather than generic promotions for unrelated items.
Compare Performance Across Segments
Once segments are defined, compare metrics like CAC, ROAS, and CLV across groups to identify those delivering the best return.
Leverage predictive analytics and AI tools to assess purchase likelihood and churn risk. These tools can identify high-intent visitors who haven’t purchased yet or customers likely to churn, allowing you to target them with tailored offers and win-back campaigns [3].
To keep segmentation manageable, begin with 5–10 groups and prioritize using the SCALE framework: Size (segment size), Currency (spending power), Access (ease of reach), Love (brand loyalty), and Early Adopters (willingness to try new products) [13]. Use holdout tests to measure the incremental impact of segmented campaigns. By excluding a small control group, you can compare conversion rates to determine whether targeting drove new revenue or simply captured existing demand [5].
With well-defined and validated segments, AI tools can help automate insights and speed up decision-making processes.
How to Use AI Tools Like Averi AI
AI tools like Averi AI can transform how you manage campaigns by moving seamlessly from gathering data to delivering actionable insights. These tools not only streamline data collection but also help identify which customers are most likely to convert, enabling faster optimization. The key is to select platforms that integrate smoothly with your existing systems and provide actionable recommendations right away.
Automate Your Data Collection and Reporting
Modern AI platforms connect directly to tools like social media accounts, Google Analytics, and CRM systems, pulling data automatically [8]. For example, Averi AI’s AGM-1 model processes brand guidelines, past campaigns, and tone-of-voice documents in just minutes [8].
The platform covers the entire workflow - from strategy and SEO to publishing and analytics - ensuring data flows effortlessly between execution and reporting [17]. By using AI effectively, marketing teams can save an average of 3 hours per piece of content [17]. These platforms also generate detailed channel plans, funnel maps, and KPIs and metrics dashboards, showing exactly where to focus your efforts [8].
AI-Driven Insights for Smarter Campaigns
AI tools excel at analyzing content performance to uncover growth opportunities and suggest high-value topics automatically [6]. Averi AI, for instance, continuously tracks trending keywords and monitors competitor content to provide recommendations aligned with current market trends [6][9]. A notable example: in March 2026, Averi’s internal marketing team utilized its "Strategy Map" feature to scale from 0 to 1.68 million monthly impressions in just 10 months - a staggering 6,000% increase in search and AI search visibility during the first six months [6][9].
Additionally, Averi helps structure content for both traditional SEO and Generative Engine Optimization (GEO), ensuring brands are cited by AI systems like ChatGPT, Perplexity, and Google AI Mode [6][9]. For context, LinkedIn ranks as the second most-cited source across AI search platforms, with 89,000 unique URLs appearing in AI-generated answers [9]. By employing techniques like "Answer Capsules" - short, 40 to 60-word snippets in H2 headers - brands can significantly improve their chances of being cited by AI search tools [6].
"Averi analyzes performance, spots opportunities, and queues new content recommendations. Your engine gets smarter every week." - Averi.ai [6]
These insights don’t just improve content strategy - they also lay the groundwork for predictive analytics to refine decision-making.
Make Smarter Decisions with Predictive Analytics
Predictive analytics takes things a step further by forecasting customer behavior and guiding budget allocation. Advanced ecommerce tools can score visitors based on their likelihood to buy and their product preferences, enabling brands to target high-intent customers with tailored offers [3]. Predictive models can also estimate customer lifetime value (LTV), which helps optimize ad spend by focusing on high-value customers.
Brands that adopt advanced attribution systems and analytics infrastructure often see revenue gains while keeping ad spend growth in check through identity resolution and multi-touch attribution [3][4]. AI agents further enhance efficiency by flagging anomalies and recommending budget adjustments before inefficiencies escalate [4].
For every dollar invested in generative AI, companies report a 3.7x return [17]. With 97% of marketing leaders predicting that AI skills will be critical for marketers by 2025 [17], incorporating predictive analytics into your workflow isn’t just a good idea - it’s a necessity for staying competitive. These predictive insights pave the way for turning analytics into meaningful marketing actions.
How to Turn Analytics into Action
Once you’ve got unified data and precise attribution in place, the next step is acting quickly on performance insights to drive revenue. The brands that succeed don’t sit on their findings - they refine campaigns, tailor customer interactions, and test new strategies based on what the data reveals.
Improve Campaigns Using Performance Data
The first priority is identifying where your marketing budget isn’t delivering. Start by spotting inefficiencies: cut keywords that generate lots of impressions but few clicks, or clicks that fail to convert [18]. Use AI tools to detect creative fatigue - when ad visuals stop resonating - so you can refresh them before performance drops [3].
Compare platform ROAS with blended and multi-touch attribution to uncover campaigns that take credit for sales they didn’t actually drive [4][3]. Break down large ad groups into smaller, more focused sets of 10–20 keywords to increase relevance and lower your cost per click [18]. Shift focus to high-margin products instead of chasing volume [18]. For competitive keywords, targeting the 3rd or 4th ad position can maintain visibility while significantly reducing costs [18].
But analytics isn’t just about improving campaigns - it’s also a tool for delivering more personalized customer experiences.
Personalize Customer Experiences
Analytics allows you to move beyond generic marketing and treat customers as individuals. Instead of relying on basic demographics, use first-party identity resolution to recognize 30–50% of your site visitors, compared to the industry average of just 5–15% [3][4]. Once identified, predictive audience scoring can pinpoint which visitors are most likely to buy, what products they prefer, and their potential lifetime value [3][4].
Connect your analytics platform to execution tools like email, SMS, and ad platforms to enable real-time, personalized campaigns [3][4]. For instance, set up automated re-engagement flows for customers who haven’t purchased in 90 days, or target cart abandoners with tailored product offers [3]. Suppress recent buyers from acquisition ads to cut unnecessary spending and enhance their experience [3].
Brands that leverage advanced first-party insights have reported a 20% lift in ROAS on platforms like Meta and Google [3]. The key is transitioning from manual, static segmentation to AI-powered, real-time personalization that activates immediately.
Review, Test, and Improve Continuously
Make it a habit to review performance regularly - monthly or quarterly - to adjust channel budgets based on results [3]. Before trying new strategies, establish a baseline by tracking key metrics like revenue, contribution profit, funnel performance (traffic, average order value), and blended customer acquisition cost [5]. Treat new tools or approaches as experiments, running them for 30–90 days while using incrementality and holdout tests to confirm whether they’re driving new sales or just taking credit for existing ones [3][5].
In August 2024, Swappie used a marketing mix model within their BigQuery data warehouse to simulate budget scenarios. By forecasting sales at various spending levels, they pinpointed the optimal investment for each channel, achieving a 15% boost in ROAS [19].
Adopt a "Scale, Optimize, or Sunset" framework: scale strategies that show clear profit increases, fine-tune those with potential, and phase out anything that doesn’t deliver incremental gains [5].
"Analytics without a decision process attached to it does not change outcomes" - Sushil Goel, LayerFive [3]
The fastest-growing brands don’t just collect data - they act on it, closing the loop from insight to execution every week. This continuous cycle of data-driven decisions is what turns analytics into real business growth.
Conclusion
Marketing analytics has the power to turn raw data into tangible revenue growth. Brands that succeed often start with a unified analytics framework, simplifying attribution and segmentation. This is a critical step, especially since 65.7% of marketing leaders identify data integration as their biggest measurement hurdle [4][7].
AI tools, like Averi AI, bridge the gap between insights and actionable strategies. By automating data collection, identifying performance issues early, and targeting high-propensity audiences, these tools make it easier to act on data. For instance, leveraging first-party resolution and AI-driven adjustments can lead to a 20% boost in ROAS, as previously discussed [3].
However, analytics only drives growth when insights are put into action. Whether it’s cutting underperforming keywords, refreshing outdated creative, or tailoring customer experiences based on predicted lifetime value, continuous testing and adjustments are key. Take Billy Footwear as an example - they achieved a 36% year-over-year revenue increase with just a modest bump in ad spend [4][3][7].
This process thrives on unified tracking and proactive optimization, as outlined earlier. The most successful ecommerce brands don’t just measure - they create a continuous loop of data-driven decisions. By establishing your framework, using AI to handle the heavy lifting, and turning insights into meaningful actions, you can drive sustainable growth.
FAQs
What’s the fastest way to unify my ecommerce data without engineering help?
To bring all your ecommerce data together without needing help from an engineering team, consider using an ecommerce analytics platform. These tools simplify the process by automatically pulling data from sources like Shopify, Google Analytics, ad platforms, email tools, and CRMs. They centralize everything into a single, real-time dashboard, saving you from tedious manual exports and data merging. This streamlined approach lets you focus on making quicker, informed decisions based on accurate insights.
How do I know if my ROAS reflects true profit after returns and repeat purchases?
To get a better handle on your ROAS and ensure it reflects actual profit, it's important to focus on net revenue, contribution margin, and customer lifetime value (CLV):
Net Revenue: Start by subtracting returns from your gross revenue. This gives you a more accurate measure of the money you're actually keeping.
Contribution Margin: Take your net revenue and deduct variable costs like production, shipping, or advertising tied to each sale. This shows how much each sale contributes to covering fixed costs and generating profit.
Customer Lifetime Value (CLV): Consider the long-term value of customers, especially if they’re likely to make repeat purchases. This helps you gauge profitability over time, not just per transaction.
By focusing on these metrics, you’ll gain a deeper understanding of your true profitability, rather than just relying on top-line revenue.
When should I run incrementality or holdout tests, and how big should they be?
To understand the actual impact of your marketing campaigns, consider running incrementality or holdout tests. These methods help determine whether your efforts are genuinely driving conversions or if those conversions would have happened regardless.
To get reliable insights, make sure your test and control groups are similar in composition and large enough to reveal meaningful differences. The required group size will depend on your overall traffic and conversion rates. Lastly, work with clean, unified data to ensure your results are accurate and actionable.
Related Blog Posts

Zach Chmael
CMO, Averi
"We built Averi around the exact workflow we've used to scale our web traffic over 6000% in the last 6 months."
Your content should be working harder.
Averi's content engine builds Google entity authority, drives AI citations, and scales your visibility so you can get more customers.