In This Article
Use event tracking, cohort analysis, and A/B testing to boost enrollments, engagement, and ROI on education platforms.
Updated:
Trusted by 1,000+ teams
Startups use Averi to build
content engines that rank.
Marketing analytics can transform how education platforms attract and retain students. By focusing on actionable data, rather than vanity metrics like impressions, you can identify key areas to improve enrollment, engagement, and ROI. Here's what matters most:
Key Metrics: Track conversion rates, cost per acquisition (CPA), and student engagement (e.g., module completion rates).
Tools: Use platforms like Google Analytics 4 (GA4) for event tracking and Averi AI for content insights.
Student Behavior: Analyze where students drop off, segment users by behavior, and personalize outreach for better retention.
Campaign Optimization: Refine ad targeting, email strategies, and campaign attribution to maximize ROI.
Continuous Improvement: Use cohort analysis and A/B testing to refine content and marketing strategies over time.
Intro to Market Analytics & Data-Driven Marketing Decisions
Key Metrics for Education Platforms
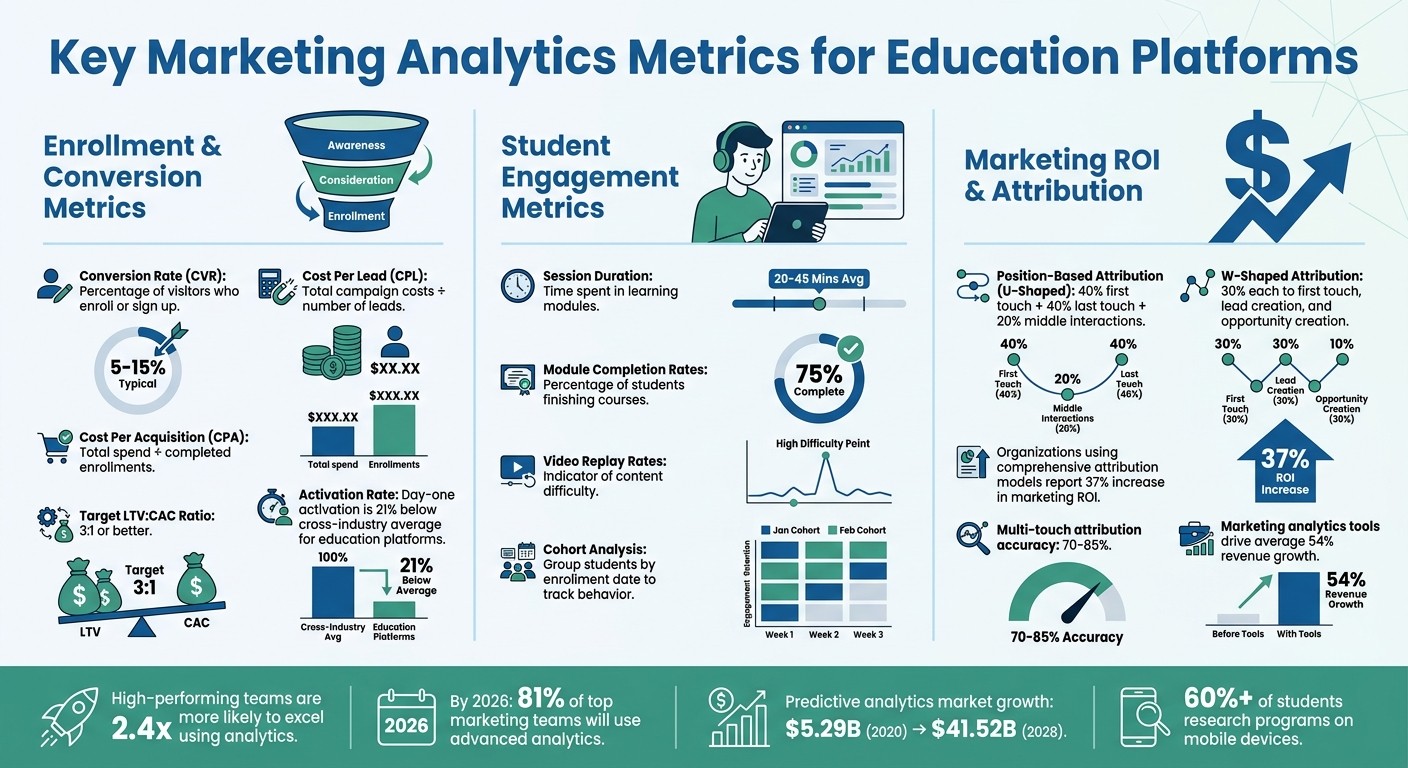
Key Marketing Analytics Metrics for Education Platforms
Focusing on metrics that directly influence revenue and student success is critical for education platforms. The following metrics are closely tied to enrollment outcomes and the long-term performance of your platform.
Enrollment and Conversion Rates
Conversion Rate (CVR) reflects the percentage of visitors who take a desired action, such as signing up for a trial, booking a consultation, or enrolling in a course [4]. For education platforms, this metric highlights how well your landing pages, course previews, and pricing turn curious visitors into committed students.
Breaking down the enrollment funnel into stages - awareness, consideration, and enrollment - can pinpoint specific challenges [4]. For instance, a high drop-off during the consideration stage could mean your course descriptions or social proof need improvement. If prospective students abandon the enrollment process, it might signal issues with pricing or the checkout experience.
Metrics like Cost Per Lead (CPL) and Cost Per Acquisition (CPA) are essential for measuring marketing success and assessing the sustainability of your spend [4]. CPL is calculated by dividing total campaign costs by the number of leads generated, while CPA divides total spend by completed enrollments. Aiming for an LTV-to-CAC ratio of 3:1 or better is a good rule of thumb [4].
Time to Convert is especially relevant for platforms offering high-ticket courses, such as the $3,200 Harvard Marketing Analytics course [6]. Tracking the time from initial contact to enrollment can help refine follow-up efforts and improve conversion rates.
Activation Rate measures the percentage of new users who engage with key content right away, such as completing their first lesson or attending a live session [4]. Since day-one activation rates for education platforms are 21% below the cross-industry average [5], investing in a strong onboarding experience is essential for retaining students.
Once enrollment metrics are optimized, the next step is to focus on how students engage with your content.
Student Engagement Metrics
Understanding how students interact with your content is vital for long-term success. Engagement metrics show whether students find your courses valuable or if they're losing interest. High video replay rates or significant drop-offs within specific modules can indicate that content may be too difficult or unappealing, signaling a need for updates [3].
Key metrics to track include session duration, module completion rates, and visual engagement tools like heatmaps [3]. These insights help identify and address content bottlenecks, making calls to action like "Apply Now" or "Enroll" more effective.
Segmenting students by behavior - such as highly engaged versus at-risk - allows for more personalized communication [3]. For example, automated emails can reconnect lapsed learners by reminding them of their goals instead of sending generic "we miss you" messages [2]. With slower growth in daily active users, strong retention strategies are becoming increasingly important [5]. Cohort analysis, which groups students by their enrollment date, can also reveal how changes in marketing or course delivery impact long-term behavior. If one cohort shows lower completion rates, it’s worth investigating what adjustments may have caused the decline [3].
Lead Sources and Campaign Attribution
Knowing where your students come from is crucial for optimizing your marketing budget. Accurate attribution ensures each dollar spent contributes to both student acquisition and engagement. Attribution models assign credit to various touchpoints in the student journey. Many education marketers favor Position-Based Attribution (U-Shaped), which gives 40% credit to the first touch (discovery) and last touch (enrollment trigger), with 20% distributed across middle interactions [4].
For platforms with longer sales cycles, W-Shaped Attribution works well. This model allocates 30% credit each to the first touch, lead creation, and opportunity creation [8], making it ideal for high-ticket courses or corporate training programs involving multiple decision-makers.
Organizations using comprehensive attribution models report a 37% increase in marketing ROI [7]. Tools like Ruler Analytics link marketing efforts directly to CRM revenue [9], while platforms like HubSpot Marketing Hub offer built-in revenue attribution across channels [7]. Google Analytics 4 (GA4) provides a free, machine learning–powered option for data-driven attribution [7][9].
Distinguishing between high-intent channels (e.g., search and email) and discovery channels (e.g., social media and YouTube) is essential for accurate conversion tracking [1]. Multi-touch attribution typically achieves 70–85% accuracy in linking marketing efforts to conversions [7]. Regularly reviewing your attribution setup ensures it stays aligned with evolving student behavior [8].
High-performing marketing teams are 2.4 times more likely to excel in key business metrics by leveraging analytics [7]. By 2026, 81% of top marketing teams are expected to rely on advanced analytics platforms [7], a trend fueled by the growth of the predictive analytics market, projected to increase from $5.29 billion in 2020 to $41.52 billion by 2028 [3].
Setting Up Analytics Tools
Once you've identified the key metrics to track, it's time to implement analytics tools that can precisely capture student interactions. This eliminates guesswork and provides insights you can act on. Education platforms need to go beyond basic page view tracking - things like enrollment triggers, video engagement, and drop-off points are critical. Setting up these tools involves configuring them to track specific behaviors, connecting them to your content systems, and creating dashboards that focus on meaningful insights rather than superficial data.
Using Google Analytics to Track Key Events
Google Analytics 4 (GA4) operates differently from its predecessors, emphasizing event-based tracking rather than traditional page views. For education platforms, this means you can monitor specific actions like "Started Free Trial", "Completed Module 1", or "Watched 75% of Introduction Video." To get started, identify key events tied to revenue, such as course enrollments or video completions[1].
Setting up these events can be done by adding code snippets directly to your platform or using Google Tag Manager for a no-code solution. For example, you might track video engagement by configuring an event that triggers when a student watches a significant portion of a course preview. This kind of data can help you understand which content drives enrollment decisions. You can also supplement this with visual tools like heatmap overlays to analyze landing page performance.
Focus on metrics that matter - conversion rates by channel, time spent on high-intent pages, and bounce rates for course pages. Be selective to avoid cluttering your dashboards with unnecessary data[3]. Establish clear naming conventions and tagging standards to ensure reports remain consistent as your platform evolves. While GA4 handles precise event tracking, you can use additional tools to refine your understanding of content performance.
Integrating Averi AI for Content Performance Insights
GA4 excels at event tracking, but tools like Averi AI can take content analysis to the next level. Averi AI connects directly to your website, analyzing its tone and performance. By simply inputting your platform’s URL, Averi scrapes the site to build a brand profile that aligns content analysis and recommendations with your platform's positioning.
For education platforms, Averi tracks metrics like impressions, clicks, and keyword rankings, delivering actionable suggestions instead of just raw data. For instance, if a blog post titled "Is a Data Science Bootcamp Worth It?" ranks poorly, Averi might recommend adding a targeted FAQ section, updating statistics, or strengthening internal links to related course pages. These recommendations are based on competitor analysis and gaps in the market.
Averi integrates seamlessly with CMS platforms like WordPress, Webflow, and Framer. You can automate publishing workflows while maintaining quality checks by setting posts to save as drafts for review. For Webflow users, mapping custom fields - such as course levels, subject tags, and learner personas - can enhance the context for both search engines and AI tools.
Creating Custom Dashboards and Reports
With data from tools like GA4 and Averi AI, you can build custom dashboards that tie analytics directly to student outcomes. These dashboards should focus on metrics that show real value to stakeholders, like course completion rates, job placements, or salary improvements for graduates[2]. Unlike vanity metrics such as page views or social media followers, these figures demonstrate the tangible impact of your platform.
Segment dashboards by behavior and demographics, using cohort analysis to track how marketing adjustments affect engagement over time[3]. For example, group students into categories like "highly active learners" or "at-risk students" (those who haven’t logged in for days) to enable personalized interventions.
Keep an eye on red flag metrics that might signal content issues. For instance, if a large number of students drop out during a specific module, it could indicate that the material needs improvement. Tools like heatmaps can help pinpoint which parts of the course pages hold students’ attention and where they disengage[3].
Real-time analytics allow instructors to make quick adjustments to content, ensuring better outcomes for students. Regularly cleaning your data is also essential to maintain the accuracy of your reports as your platform grows.
Analyzing User Behavior and Engagement
Once your data collection tools are up and running, the next step is figuring out what the numbers actually mean. Metrics like page views or session counts are just the beginning. The real challenge is uncovering the "why" behind user actions - why some students complete courses while others drop off, why certain content resonates, or where users encounter obstacles. By digging into these patterns, you can better understand user behavior and craft strategies to improve engagement.
Segmenting Users by Demographics and Interests
Breaking your audience into segments is key to understanding how different groups interact with your platform. Behavioral segmentation focuses on actions - like how often students replay videos, where they drop off, or which modules spark the most questions[3]. This helps identify students who may be struggling versus those excelling. On the other hand, demographic segmentation is equally important. For example, teens may respond differently to content compared to working adults, so tailoring communication styles is crucial[3].
Education platforms often serve three main groups: individual learners (or their parents), institutions like schools and universities, and corporate training teams[2]. By tracking specific interactions - such as repeated video replays or frequent questions - you can create actionable user segments. Combining behavioral data with demographic filters allows for hyper-targeted outreach. Over time, analyzing these groups can reveal trends in retention and engagement.
Using Cohort Analysis to Improve Retention
Segmentation lays the groundwork for cohort analysis, which takes a deeper look at how groups behave over time. This method groups students by shared traits or actions, enabling you to measure the impact of changes - like revising a course module or tweaking the onboarding process - on outcomes. For instance, time-based cohorts group students by their enrollment date, making it easier to compare behaviors across different enrollment periods[3].
Activity-based cohorts, on the other hand, focus on specific actions, such as completing assignments or participating in discussion forums. These can reveal behaviors linked to higher retention rates[3]. Pinpointing dropout points is another critical use of cohort analysis. If many students abandon a particular module, it could signal that the content is either too difficult or poorly explained[3]. Micro-metrics like video replay rates or the locations where students ask questions can help identify exactly where the learning experience needs improvement[3].
A/B Testing Content and Campaigns
A/B testing is a powerful tool for figuring out what works and what doesn’t. Start with high-traffic pages that aren’t converting as well as they should[12]. Test one element at a time - whether it’s the headline, the placement of a video, or the type of social proof used. For example, compare student testimonials with alumni success stories to see which builds more trust[1]. Tools like Hotjar or Contentsquare can help identify problem areas before you even begin testing[10][12].
Google Analytics 4’s behavior flow analysis is another valuable resource, showing exactly where users drop out of the enrollment funnel[10]. With over 60% of students researching programs on mobile devices[1], make sure mobile responsiveness is a top priority for your tests. A/B testing can also extend beyond landing pages - experiment with email subject lines, course preview videos, and onboarding flows within your app[11][12].
AI-powered tools can further enhance your efforts by analyzing real-time data to suggest variables for testing[11]. Feeding successful test results back into AI systems creates a feedback loop, allowing for personalized content and continuous refinement of your strategy[12]. By applying these insights, you can keep improving both your content and your campaigns to better meet user needs.
Optimizing Marketing Campaigns with Analytics
Understanding user behavior is just the starting point. For education platforms, which often deal with long decision-making processes and varied audiences, the real value lies in using analytics to fine-tune targeting, messaging, and budget allocation. Once you've gathered insights, the challenge is turning them into actionable improvements for your campaigns. Here's how analytics can refine ad strategies, boost email performance, and enhance social media efforts.
Refining Ad Targeting and Messaging
Focus on the channels that generate the best return on investment. For example, Google Ads works well for high-intent searches, while LinkedIn is effective for engaging corporate training managers [1][3]. Use your analytics tools to compare metrics like cost per lead and conversion rates across platforms, then reallocate your budget to the most productive channels. Additionally, segmentation data allows you to craft more relevant ad messaging.
Demographic filters can sharpen your approach further. Teens and working professionals respond to different tones, visuals, and calls to action, so tailor your ads accordingly [3]. Tools like Facebook Audience Insights and SparkToro provide deeper insights into audience preferences and behaviors, helping you move beyond assumptions [1]. Predictive analytics adds another layer by analyzing historical data to forecast demand for specific courses, enabling proactive campaign adjustments.
Improving Email Campaign Performance
Email remains a key channel for education platforms due to the extended nature of learner journeys, which can span months or even years [2]. Analytics can help you fine-tune every aspect of your email campaigns, from subject lines to ideal send times. For instance, if emails sent on Tuesday mornings consistently outperform those sent on Friday afternoons, shift your schedule to reflect this insight. Tracking open rates and click-through rates reveals what resonates most with your audience.
Automated email workflows are especially useful for nurturing leads. For example, if a user downloads a course preview but doesn’t enroll, you can trigger a personalized sequence addressing common objections and highlighting success stories [1]. Segmentation also plays a crucial role - send advanced content to highly engaged students while simplifying onboarding emails for those who show early disengagement [3]. Heatmaps can further refine your strategy by revealing which parts of your emails get the most attention, helping you design more effective layouts [3].
Tracking Social Media Trends and Sentiment
Social media is a dual-purpose tool: it’s a discovery channel and a feedback mechanism, particularly for younger audiences and professionals [1]. Sentiment analysis tools can scan comments and reviews to uncover strengths and areas needing improvement [3]. For instance, if multiple users describe a course as "too technical", it might be time to adjust your messaging or introduce beginner-friendly options.
Staying on top of industry trends is equally important. If "AI skills" becomes a hot topic among your audience, create posts or ads that highlight relevant courses. Tools like Meta Business Suite and SparkToro can help you track engagement and identify what resonates across platforms [1]. Don’t underestimate the power of social proof - integrating positive reviews from platforms like Trustpilot or G2 can enhance credibility and influence prospective students. By continuously aligning social feedback with your platform data, you create a feedback loop that strengthens all aspects of your marketing strategy.
Measuring ROI and Continuous Improvement
Focusing on conversions is crucial, but understanding the profitability of your campaigns is what drives long-term success. For education platforms, this can be particularly tricky. With long sales cycles, multiple touchpoints, and extended research periods before enrollment, calculating ROI accurately becomes a real challenge. Missteps here can lead to wasted budgets and underperforming campaigns. Breaking these metrics into actionable steps can help you make immediate and impactful adjustments.
Calculating Customer Acquisition Cost (CAC) and Return on Ad Spend (ROAS)
To calculate Customer Acquisition Cost (CAC), divide your total marketing expenses - this includes ad spend, software costs, content creation, and team salaries - by the number of new enrollments. A common mistake is focusing only on ad spend, which gives a misleading picture of your actual costs [15].
Return on Ad Spend (ROAS) measures how much revenue you earn for every dollar spent on advertising. For instance, if you invest $1,000 in Google Ads and enroll students who collectively pay $5,000, your ROAS is 5:1. Beyond ROAS, keep an eye on your LTV:CAC ratio (lifetime value to customer acquisition cost). A benchmark ratio of 3:1 means that each student generates three times the cost of acquiring them [15].
Tracking ROI is not just a best practice - it’s a competitive advantage. Businesses that monitor ROI are 1.6 times more likely to see positive marketing results [14]. Use tools like UTM parameters on campaign URLs to pinpoint which channels are driving conversions [14][15].
Using Data-Driven Recommendations from Averi AI
Basic metrics are just the starting point. Platforms like Averi AI take things further by offering real-time insights to optimize campaigns. For example, Averi can identify trending topics or content gaps, helping you adjust your strategy before competitors catch on.
The platform also analyzes which content drives the most engagement and enrollments, using this data to shape future strategies. Let’s say your "How to Choose an Online MBA" guide consistently outperforms other pieces. Averi will suggest creating similar content and formats, creating a feedback loop where performance data directly informs your next steps. This approach ensures that each new piece of content becomes more effective than the last.
Creating a Feedback Loop for Optimization
Analytics should be treated as an ongoing process, not a one-time task. Set up systems where performance data automatically triggers adjustments. If certain email send times or ad platforms consistently perform better, shift your focus and reallocate resources accordingly.
Cohort analysis can provide additional insights. By grouping students based on their enrollment dates, you can track how specific marketing changes impact long-term outcomes [3]. For instance, if you updated your landing page in March, compare the behavior of students who enrolled before and after the change. This can reveal whether your updates are improving the quality of enrollments, not just increasing the numbers.
Marketing analytics tools have been shown to drive an average of 54% revenue growth [13], but the key is acting on the insights they provide. Regularly review metrics like CAC, ROAS, and content performance - monthly is a good cadence - and adjust your tactics based on the data. The goal isn’t perfect data; it’s steady, evidence-based improvement. This kind of feedback loop not only sharpens your financial outcomes but also enhances student engagement and enrollment success on your platform.
Conclusion
Marketing analytics has become a game-changer for education platforms, transforming guesswork into precise, actionable strategies. By focusing on meaningful metrics like conversion rates, student engagement, course completion rates, and lead attribution, platforms can identify areas for improvement and campaigns that truly make an impact. While vanity metrics may look impressive, it’s the actionable data that uncovers critical drop-off points and highlights what works best [3].
The tools you choose are important, but how you use them matters even more. Google Analytics offers a strong foundation for tracking user behavior and campaign performance. Combine this with platforms like Averi AI, which can turn raw data into content strategies that drive results. Together, these tools create a feedback loop that allows your content and campaigns to evolve based on measurable outcomes.
A data-driven approach opens the door to continuous testing and optimization. Start with the essentials: identify where students lose interest, segment your audience based on behaviors, and A/B test elements like email subject lines or course previews [3]. From there, you can incorporate advanced techniques such as cohort analysis to improve retention, predictive analytics to identify at-risk students, and real-time dashboards to adjust campaigns instantly.
With predictive analytics gaining momentum, even smaller education platforms can benefit by adopting smart analytics strategies. Ignoring data is no longer an option for platforms looking to stay competitive. As Averi aptly puts it:
"If you're not measuring, you're just guessing." – Averi [1]
Success in education marketing comes from treating analytics as an ongoing process, not a one-time task. Build a consistent feedback loop, keep a close eye on the right metrics, and act quickly on the insights you uncover.
FAQs
Which 3 metrics should I track first?
User Engagement: Pay attention to how users interact with your platform. Metrics like time spent on the site, the number of pages viewed, and content interactions can reveal how effectively your platform captures and retains attention.
Conversion Rates: This measures the percentage of visitors who take meaningful actions, such as enrolling as students or becoming active users. It’s a direct reflection of how well your marketing efforts are working.
Trust Indicators: Reviews, testimonials, and referrals are essential for building credibility. In the education sector, trust plays a significant role in influencing decisions.
Focusing on these metrics offers valuable insights into user behavior and helps refine your campaigns for better results.
What GA4 events should an education platform set up?
When setting up GA4 for an education platform, the events you track should align with your platform's goals. Commonly tracked actions include course views, enrollments, completions, content engagement, and form submissions. These events provide insights into user behavior, helping refine both marketing strategies and the overall user experience. Examples of event names might include view_item, enroll, complete_course, content_engagement, and form_submit, customized to reflect the core activities on your platform.
How can I measure ROI with long enrollment cycles?
To evaluate ROI during lengthy enrollment cycles, focus on tracking critical metrics over an extended period and studying user behavior to understand how your marketing efforts are working. Start by defining clear, measurable objectives and observing how various touchpoints contribute to enrollment decisions throughout the cycle. Leverage analytics tools to gather insights from website interactions, engagement trends, and conversion rates. This data helps pinpoint which activities drive results, allowing you to refine your strategies and maximize ROI over time.
Related Blog Posts

Zach Chmael
CMO, Averi
"We built Averi around the exact workflow we've used to scale our web traffic over 6000% in the last 6 months."
Your content should be working harder.
Averi's content engine builds Google entity authority, drives AI citations, and scales your visibility so you can get more customers.