How to Use Marketing Analytics for Media & Entertainment

Averi Academy
Averi Team
8 minutes

In This Article
Unify streaming, social, and ad data to track engagement, predict churn, and optimize content with AI.
Updated:
Trusted by 1,000+ teams
Startups use Averi to build
content engines that rank.
Marketing analytics is transforming how media and entertainment companies connect with audiences. By analyzing data from streaming platforms, social media, and advertising channels, businesses can better understand viewer behavior, improve engagement, and optimize content strategies. Here's what you need to know:
Why It Matters: With audience habits scattered across devices and platforms, guessing no longer works. Analytics helps pinpoint what keeps viewers engaged and reduces churn.
Key Metrics: Focus on audience engagement (views, retention), content performance (traffic, drop-off rates), and campaign ROI (CPA, ROAS, churn rate).
Data Integration: Combine data from tools like Google Ads, social media, and streaming platforms into one dashboard for a clear view of performance.
AI and Predictive Analytics: Use AI to predict audience behavior, personalize content, and refine campaigns in real time.
This approach helps businesses make smarter decisions, retain audiences, and drive revenue growth. Start by setting clear goals, tracking the right metrics, and integrating data sources for actionable insights.
Making Data-Driven Decisions in Entertainment with Anjali Midha
Which Metrics to Track in Media & Entertainment
Tracking the right metrics is essential for media and entertainment companies aiming to refine their strategies and boost revenue. A well-curated dashboard focusing on audience engagement, content performance, and campaign ROI can provide actionable insights without overwhelming you with unnecessary data. Each metric highlights a unique aspect of your business's overall health.
Audience Engagement Numbers
Engagement metrics reveal how deeply your audience connects with your content. For TV and traditional media, metrics like average viewing time and audience share remain critical. Meanwhile, streaming and OTT platforms rely on unique views, viewer retention, and average view duration to evaluate whether audiences are sticking with content or simply sampling it [2].
In the realm of digital content, metrics such as time on page, scroll depth, and bounce rate offer insights into reader interaction [1]. On social media, tracking likes, shares, comments, and performing sentiment analysis helps you understand not just the volume of engagement but also the audience's emotional response to your content [1][6]. Additionally, cohort analysis - grouping users based on acquisition date or behavior - can help identify moments that either build long-term loyalty or lead to churn [1][2]. Understanding why subscribers disengage is essential for improving retention.
Content Performance Data
Content performance metrics measure visibility and how your audience interacts with your material. Start with the basics: organic traffic, page views, social shares, total reach, and follower growth [1][5]. These figures show whether your content is being discovered and shared across platforms.
However, raw numbers only tell part of the story. Pair them with retention and drop-off analysis to identify where viewers lose interest. This allows you to refine pacing and structure in future projects [3][2]. Similarly, analyzing which sections of your content are frequently rewatched or generate high engagement can pinpoint features worth replicating [3].
These insights feed directly into evaluating the financial impact of your marketing campaigns.
Campaign ROI Numbers
Revenue metrics are the ultimate measure of a campaign's success. Key indicators include Cost Per Acquisition (CPA), Return on Ad Spend (ROAS), Conversion Rate (CVR), Click-Through Rate (CTR), and Churn Rate [1][5]. These metrics tie your marketing efforts directly to financial outcomes.
Metric Category | Key Metrics | What It Measures |
|---|---|---|
Financial ROI | CPA, ROAS, Payback Period | Profitability and efficiency of marketing spend |
Campaign Performance | CVR, CTR, Deal Velocity | Effectiveness of specific marketing strategies |
Retention | Churn Rate, Repeat Visit Rate, LTV | Customer loyalty and content "stickiness" |
Research shows that companies prioritizing customer experience achieve revenue growth 4–8% higher than their competitors [4]. Additionally, 86% of buyers are willing to pay more for a superior experience [4]. This underscores the importance of not only tracking acquisition costs but also emphasizing lifetime value and retention rates. A long-term subscriber contributes far more value than one who churns early.
Up next, we’ll explore how to gather and integrate these metrics from various sources to create actionable insights.
How to Collect and Combine Data from Multiple Sources
Media and entertainment companies gather data from a variety of platforms, including streaming services, social media, ad networks, CRMs, and web analytics tools. The real challenge isn't locating this data - it's bringing it together into a single, unified view. Without this integration, it's nearly impossible to make consistent comparisons across platforms, identify trends that span multiple channels, or make decisions based on a complete picture.
Where to Find Your Data
Your data sources can be grouped into several key categories:
Advertising platforms: Tools like Google Ads and Facebook provide metrics such as impressions, clicks, cost per click, and return on ad spend.
Social media channels: Platforms like Twitter, Instagram, and LinkedIn offer insights into reach, follower growth, and audience sentiment.
Streaming and content platforms: Services like YouTube and TikTok track metrics like views, watch time, and completion rates.
Customer engagement tools: Solutions like Google Analytics and HubSpot CRM measure website sessions, bounce rates, customer lifetime value, and churn rates.
Revenue systems: Platforms such as Stripe and internal billing systems monitor subscription revenue and average revenue per user [1][2].
By integrating these metrics, businesses can achieve a unified view, enabling more accurate insights and better decision-making. For instance, in January 2024, Disney utilized its AI-powered content recommendation platform, "Amplify", to enhance personalization on Hulu and ESPN+. This system consolidated data from multiple sources to refine streaming recommendations and ad targeting [10].
Tools for Data Integration
To combine data from diverse sources, data integration platforms offer prebuilt connectors that centralize information into one dashboard. Here’s a quick look at some options:
Whatagraph: Offers over 55 native integrations, starting at $229/month for 20 source credits, with data updates every 30 minutes.
AgencyAnalytics: Provides more than 80 integrations, starting at $79/month, though SEO data updates only every 24 hours.
Klipfolio: Supports 130+ integrations, priced at $300/month for 10 users, with refresh rates ranging from 15 minutes to 4 hours [7].
The true value of these platforms lies in their ability to standardize metrics across different tools. For example, when one platform refers to "location" and another uses "region", data blending features ensure these terms are unified, making comparisons seamless [7]. A great example of this approach is French publisher Le Monde, which increased subscriptions by 20% in 2025 by using self-service analytics to align its product and marketing teams. This alignment provided a clearer view of the user journey across multiple data sources [2].
Lars Maat, Co-founder of Maatwerk Online, highlighted the efficiency gains from using Whatagraph's AI features:
"The hours we're saving are just pure profit - we can now focus on more strategic work" [7].
With a unified data system in place, businesses can unlock AI-driven insights to refine their marketing strategies and improve outcomes.
Using AI and Predictive Analytics to Improve Results
When your data sources are unified, AI and predictive analytics transform raw information into actionable strategies. These tools go beyond merely analyzing past trends - they predict future outcomes and automate decision-making processes that once required weeks of analysis. This shift enables deeper audience insights and more effective campaign strategies.
Understanding Audience Behavior with AI
AI tools process vast amounts of behavioral data to uncover what your audience truly values. Recommendation engines track factors like watch history, likes, viewing time, and social interactions to create personalized content feeds that keep users engaged. Content creators, in turn, use AI to identify resonant themes by analyzing conversations and engagement across platforms [8][12]. Platforms like 6sense analyze anonymous behavior and intent data to identify in-market audience segments, while Gong uses conversation analytics to reveal audience concerns that can guide your content strategy.
In gaming, dynamic difficulty adjustment (DDA) takes this a step further by analyzing player skill, response time, and strategy in real time, tailoring challenges and missions to keep players engaged [8].
Optimizing Campaigns with Predictive Models
Predictive analytics empowers smarter decisions even before campaigns begin. Studios, for example, use content success forecasting to evaluate scripts and storylines against historical data, predicting box office performance and audience appeal [11][8]. During campaigns, AI enables real-time audience segmentation, analyzing behavior as it happens. This allows for hyper-targeted ad placements, minimizing wasted spend and increasing conversions [10][9].
NBC utilizes churn and loyalty prediction models to detect patterns in cross-platform behavioral data, enabling them to implement retention strategies before subscribers decide to cancel [2]. The AI market in media and entertainment is projected to grow from $17.1 billion in 2023 to $195.7 billion by 2033, with 96% of companies in music, movies, and media already leveraging personalization in their marketing efforts [12].
Application | Predictive Use Case | Key Benefit |
|---|---|---|
Streaming | Churn Analysis | Identifies at-risk subscribers [2] |
Film Production | Script Analytics | Predicts box office success [11] |
Advertising | Real-time Targeting | Optimizes ad spend [10] |
Gaming | Adaptive Difficulty | Adjusts challenges in real time [8] |
These insights not only enhance campaign efficiency but also enable highly personalized marketing strategies.
Delivering Personalized Content and Marketing
AI-driven personalization creates experiences tailored to diverse audience segments by leveraging real-time data from unified sources. Streaming platforms are evolving from static genre categories to dynamic, prompt-based playlists. For instance, instead of generic labels like "Pop" or "Rock", users might see playlists like "relaxing music for 2002" [12]. AI-powered localization tools, such as voice synthesis and automated dubbing, ensure global content distribution remains cost-efficient while preserving emotional authenticity and syncing lip movements [12].
AI is also helping publishers by generating concise summaries of long-form content, making it easier for audiences to engage. Broadcast networks, meanwhile, are using AI to match ads with content based on contextual and behavioral targeting [12]. These advancements align with the broader goal of optimizing content distribution through data-driven insights. Platforms offering drag-and-drop interfaces for creating complex business logic - without requiring coding expertise - are making these technologies accessible to marketing teams with minimal technical experience [8].
Comparing Marketing Analytics Tools
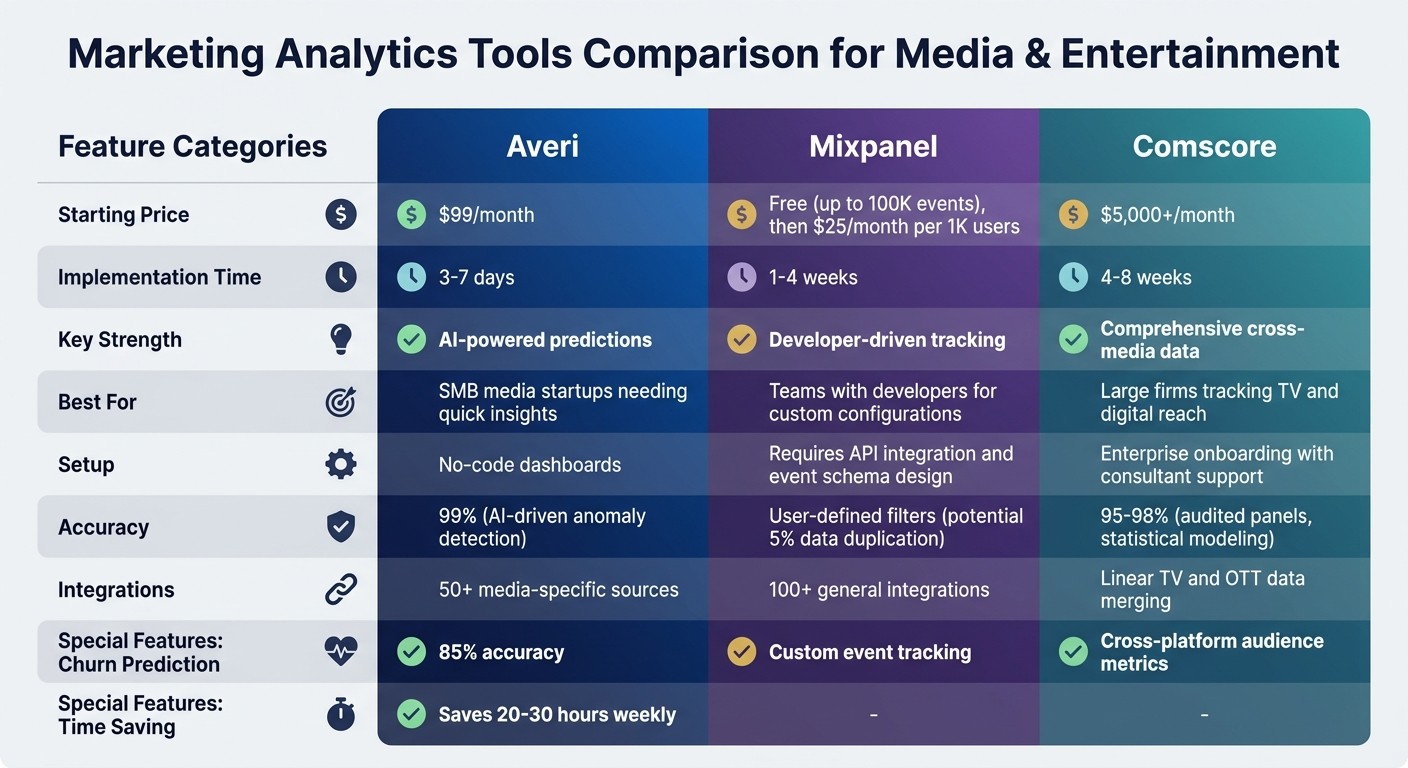
Marketing Analytics Tools Comparison for Media & Entertainment
Once you've unified your data insights, the next step is choosing the analytics tool that aligns with your business size, budget, and urgency. Media and entertainment companies often decide between AI-driven platforms like Averi, which merge strategy and execution, specialized tools like Mixpanel for user behavior tracking, or enterprise-grade solutions like Comscore that provide cross-media audience data. Each offers distinct benefits to meet varying needs.
Feature and Pricing Comparison
Analytics tools for media firms generally fall into three categories, distinguished by cost, technical setup, and how quickly they can be implemented. Averi starts at $99/month, catering to small and medium-sized businesses, with a straightforward setup that takes less than a week. Mixpanel offers a free tier for up to 100,000 tracked users monthly, scaling to $25/month per 1,000 users, with enterprise pricing potentially exceeding $10,000 annually. On the higher end, Comscore serves large entertainment companies, with contracts starting at $5,000/month and a custom onboarding process that can take 4–8 weeks, delivering detailed cross-platform audience metrics.
For teams with limited resources, implementation speed is critical. Averi's no-code dashboards allow startups to begin tracking engagement within days. Mixpanel, however, often requires 1–4 weeks for event schema design and API integration, while Comscore's enterprise-level onboarding typically spans 4–8 weeks and involves consultant support.
Quality assurance methods also differ across platforms. Averi employs AI-driven anomaly detection with automated data cleansing, achieving 99% accuracy while adhering to GDPR and CCPA standards. Mixpanel uses user-defined filters and sampling but may encounter data duplication issues, reported by some users as up to 5% in high-volume streams, necessitating manual checks. Comscore relies on audited panels and statistical modeling, delivering 95–98% accuracy but occasionally showing sampling biases in niche media segments.
Tool | Starting Price | Implementation Time | Key Strength | Best For |
|---|---|---|---|---|
Averi | $99/mo | 3–7 days | AI-powered predictions | SMB media startups needing quick insights |
Mixpanel | Free (up to 100K events), then $25/mo per 1K | 1–4 weeks | Developer-driven tracking | Teams with developers for custom configurations |
Comscore | $5,000+/mo | 4–8 weeks | Comprehensive cross-media data | Large firms tracking TV and digital reach |
This breakdown highlights the diverse options available, setting the stage for a closer look at Averi's specific advantages.
What Makes Averi Different
Averi is designed to tackle the unique challenges faced by media startups and small production companies that often lack dedicated data science teams. The platform streamlines segmentation and performance analysis, eliminating the need for technical expertise. Its automated, real-time engagement scoring for live events and predictive models - forecasting content virality up to seven days in advance - are game-changers for lean teams.
Averi goes beyond basic reporting with advanced AI capabilities. These include churn prediction with 85% accuracy, personalized content recommendations, and automated A/B testing, which can save marketing teams 20–30 hours weekly. For example, a mid-sized streaming startup improved retention rates by 25% using Averi's AI-powered personalization.
The platform integrates with over 50 media-specific data sources - such as streaming services, social media APIs, and CRMs like HubSpot - offering seamless audience engagement analysis without requiring developer involvement. In contrast, Mixpanel supports over 100 general integrations but often demands developer resources. Comscore, while excellent at merging linear TV and OTT data, requires enterprise-level technical support for its implementation.
These comparisons underline how tools like Averi combine fast insights with strategic execution, making them especially valuable for media and entertainment companies navigating a competitive landscape.
Conclusion: Using Marketing Analytics to Grow Your Business
Key Takeaways
Marketing analytics is reshaping how media and entertainment companies operate. By tracking metrics like audience engagement, content completion rates, and campaign ROI, businesses can make smarter, data-driven decisions. Consolidating data from platforms such as streaming services, social media APIs, and CRMs into a single dashboard removes blind spots and uncovers trends that might otherwise go unnoticed.
AI-powered tools designed for the media industry make personalization and data integration more efficient, enabling large-scale predictions of audience behavior. For instance, studios leveraging predictive analytics have achieved 15% higher audience growth by anticipating trends [13][16]. Similarly, companies using AI-driven segmentation for personalized marketing have increased retention by 20–30% and boosted viewership by as much as 18% [13][16]. To stay competitive, it’s crucial to regularly review metrics and update AI models, ensuring your strategy evolves alongside shifts in audience preferences and market dynamics.
With these insights, the next step is turning strategy into action.
Steps to Begin
To harness the benefits of marketing analytics, start by setting SMART goals - specific, measurable, achievable, relevant, and time-bound. For example, aim to "increase engagement by 25% within six months" and tie this to KPIs like subscriber growth or ad revenue. Align each metric with a business objective to ensure you’re focusing on what drives revenue [13][14][15].
Examine your current data sources to identify gaps in tracking audience behavior. When evaluating tools, compare features like AI capabilities, data unification options, and ease of implementation. Begin with a small-scale approach: integrate one data source, monitor essential engagement metrics, and test with a pilot campaign to confirm your data flow is reliable [13][14].
Define clear roles within your team - analysts can monitor KPIs, marketers can refine campaigns, and data engineers can manage integrations. Establish workflows with regular check-ins, such as weekly reviews, to maintain progress. Track both leading indicators (like engagement rates) and lagging indicators (such as revenue growth) to measure success. Use quarterly reviews to adjust your strategy, aiming for a 10–20% improvement in ROI [14][15][16].
FAQs
Which metrics matter most for my type of media business?
When it comes to tracking success, the right metrics depend on your content goals and how you aim to connect with your audience. If you're focusing on engagement, keep an eye on viewership, watch time, and interaction rates - these give you a sense of how well your content resonates. For businesses driven by content, organic search traffic and SEO performance are crucial for staying visible online.
If revenue is your priority, focus on conversion rates, retention, and subscription growth to understand how effectively you're turning viewers into loyal customers. Meanwhile, social media engagement and sentiment analysis provide insights into how your audience perceives your brand and interacts with it. Each of these metrics plays a role in painting a full picture of your content's impact.
How do I unify streaming, social, and ad data into one dashboard?
To bring together data from streaming, social media, and advertising, leverage AI-driven analytics tools that consolidate information into a single platform. Start by pinpointing your data sources and selecting a platform that can handle these integrations seamlessly. Set up workflows to automate data collection, ensuring everything flows smoothly into the system. Once integrated, use the platform’s dashboard to gain insights into audience behavior, evaluate campaign performance, and track content distribution across all your channels in one convenient location.
How can AI predict churn or content performance before it happens?
AI uses advanced analytics and machine learning to predict churn and assess content performance by examining how audiences behave and engage. By analyzing historical data - such as watch times, interactions, and preferences - it identifies patterns and flags early warning signs, like declining interest or viewers at risk of disengaging. This insight enables media companies to refine their strategies, tailor marketing efforts, and apply retention techniques, ultimately boosting audience loyalty and improving content results.
Related Blog Posts

Zach Chmael
CMO, Averi
"We built Averi around the exact workflow we've used to scale our web traffic over 6000% in the last 6 months."
Your content should be working harder.
Averi's content engine builds Google entity authority, drives AI citations, and scales your visibility so you can get more customers.