The 90-Day Lie: Why Your Marketing Looks Broken (When It's Actually Working)

Zach Chmael
Head of Marketing
6 minutes

In This Article
Most marketing channels lie to you for 90 days. Here's the real signal lag for content, paid, social, and brand — and how to read each one.
Updated
Trusted by 1,000+ teams
Startups use Averi to build
content engines that rank.
TL;DR
📊 The first 90 days of any marketing channel lie to you systematically — some channels overstate early signal (paid, social), some understate it (content, brand, SEO), and the dashboards founders watch are calibrated for the wrong timescale
💰 30-40% of B2B marketing budgets are wasted because attribution windows are too short — most platforms default to 30-day windows when B2B sales cycles run 84-180 days
🎯 The average B2B SaaS deal involves 7.3 marketing touchpoints; single-touch attribution credits only 1 of 7, meaning 86% of the actual journey gets zero credit on most dashboards
🚨 Up to 60% of marketing spend is misallocated under last-touch attribution — and most teams don't catch this until month 6 when revenue starts dropping for reasons they can't trace
⏱ Each channel has its own honesty horizon: paid lies in week 1, content lies for 90 days, social lies for 60 days, brand lies for 6+ months. Knowing the honesty horizon by channel is the diagnostic
⚙️ At Averi, our highest-performing pieces published in months 2-3 didn't show meaningful traffic until months 5-7 — if I'd judged them on their 30-day data, I'd have killed the workflow that produced 16,000% growth

Zach Chmael
CMO, Averi
"We built Averi around the exact workflow we've used to scale our web traffic over 6000% in the last 6 months."
Your content should be working harder.
Averi's content engine builds Google entity authority, drives AI citations, and scales your visibility so you can get more customers.
The 90-Day Lie: Why Your Marketing Looks Broken (When It's Actually Working)
Almost every founder I've talked to has killed at least one marketing channel that was working.
Not because it stopped producing results. Because the dashboard didn't show the results yet.
This is the 90-day lie.
The first 90 days of any new marketing channel — content, paid, social, podcast, brand, partnerships — produce data that systematically misrepresents what's actually happening.
Some channels overstate their early performance. Some understate it. Almost none report accurately on the timescale founders are watching them.
The result is a category-wide pattern I see in 8 out of 10 startup marketing programs: founders kill the channels that would have worked, double down on the channels that look like they're working but aren't, and end up with a worse channel mix six months later than they started with.
This piece is the diagnostic for telling actual failure from data lag — across every major marketing channel, not just organic search. Because the average B2B SaaS deal involves 7.3 touchpoints across 84-180 days, and most of your dashboards are configured for a 30-day window.
That mismatch is the lie.
Want to see your current Marketing Maturity?
What every marketing channel actually shows you in the first 90 days
The diagnostic depends on knowing which lies which channel tells. Here's the honest version, channel by channel.
Content marketing & SEO
The lie: "Nothing is happening." Impressions are small, clicks are smaller, and the chart looks flat for 60-120 days.
The truth: The work is real but the data lags. Only 1.74% of new pages reach Google's top 10 within a year — but the pieces that will eventually rank are doing the indexing, testing, and consolidation work in the background during the apparent "flat" period. The compound surfaces at month 5-6, not month 3.
Honesty horizon: 90-120 days minimum, 6 months for full diagnostic.
Founder mistake: Killing the channel at month 3 when "nothing is happening." For the SEO-specific deep-dive on this dynamic, see our piece on why your organic traffic isn't flat — it's lagging.
Paid acquisition
The lie: "Everything is working." CTR looks great, CPC looks reasonable, the dashboard shows conversions.
The truth: Paid is the channel that lies fastest in the opposite direction. The first 30 days of any paid campaign show inflated performance because the audiences are fresh and the ads are novel. By day 60, fatigue kicks in. By day 90, the actual conversion economics emerge — and they're almost always worse than the first-30-day numbers suggested.
Honesty horizon: 60-90 days for accurate CAC. The average B2B SaaS sales cycle is 84 days, which means any conversion attributed to a paid touchpoint in week 4 might not actually close until week 12 — and you won't know until then whether the channel produces revenue or just signups.
Founder mistake: Scaling paid spend in months 1-2 based on early CTR/conversion data, then watching unit economics collapse in month 4 when the audience saturates and the deals don't close.
Social media (organic LinkedIn, X, etc.)
The lie: "Nothing converts." Posts get likes but the pipeline dashboard shows zero attributed deals.
The truth: Social is dark-funnel territory. 30-50% of pipeline originates from channels that digital attribution cannot see, and social is the biggest of those channels. Your dashboard credits "direct traffic" or "branded search" for deals that started from a LinkedIn post 6 weeks ago. The channel is working. Your attribution can't see it.
Honesty horizon: 60 days for engagement signal, 6 months for revenue impact (and you'll never see the full picture in a digital attribution tool — only via self-reported attribution at the deal level).
Founder mistake: Quitting LinkedIn because "no deals come from it" when LinkedIn is actually generating 30%+ of the pipeline that closes through "direct" or "branded search."
Email & nurture sequences
The lie: "Open rates are bad. The list is dead."
The truth: Email's signal is in the long tail, not the open rate. Subscribers who don't engage with weekly emails for 8 months might be reading every issue and converting at month 9 when the company hits a buying trigger. Open rate is the most-watched, least-useful metric in email marketing. Reply rate, click-to-conversion lag, and self-reported attribution at the demo stage matter more.
Honesty horizon: 4-6 months for revenue contribution.
Founder mistake: Cleaning the list aggressively in month 3 because open rates look weak, removing the buyers who would have converted in month 9.
Podcasts & long-form content
The lie: "Numbers are tiny."
The truth: Podcasts are a relationship channel masquerading as a reach channel. Listening 15 minutes to a founder talking about a problem creates more decision influence than 50 LinkedIn impressions. But the influence shows up months later as branded search, demo requests, or "I heard you on a podcast" inbound DMs.
Honesty horizon: 6+ months for measurable revenue impact.
Founder mistake: Comparing podcast metrics (downloads) to social metrics (impressions) and concluding podcasting "doesn't scale" when it's actually doing entirely different work.
Brand & PR
The lie: "Can't measure it."
The truth: Brand work shows up downstream as branded search volume, direct traffic, and sales call qualification rates. None of those show up cleanly in marketing dashboards. The lag from a PR placement to measurable branded search lift is typically 30-90 days, and the revenue impact takes 6+ months to surface.
Honesty horizon: 6 months minimum for revenue tie-back.
Founder mistake: Dropping brand work in budget cuts because "it can't be attributed," then watching CAC across every other channel rise 6 months later when brand-driven demand stops feeding the funnel.
The attribution math nobody runs
Here's the calculation that explains why so many founders kill working channels.
The average B2B SaaS deal involves 7.3 marketing touchpoints. Single-touch attribution (first or last click — which is what most dashboards default to) credits 1 of those 7. That means 86% of the journey gets zero credit on the dashboards founders are watching.
When you look at a marketing dashboard showing "LinkedIn drove 5% of revenue," the actual answer might be "LinkedIn was involved in 40% of closed deals as one of the 7 touchpoints, but only 5% of those deals had LinkedIn as the first or last touch." Companies that switch from last-touch to multi-touch attribution typically discover up to 60% of spend was misallocated.
The attribution-window mismatch makes it worse.
73% of B2B organizations use 30-day attribution windows regardless of actual sales cycle length. For a mid-market SaaS deal with a 12-20 week cycle, a 30-day window erases every touchpoint older than 30 days from the math. The early-funnel channels — content marketing, organic search, LinkedIn awareness — get systematically zeroed out because their touches happen early in the journey and fall outside the window.
This is how you end up in the worst-case scenario: you cut the channels actually creating demand because the dashboard doesn't credit them, and double down on the channels capturing demand that the cut channels created. Six months later, demand dries up and nobody connects the cause to the effect because the lag is too long.
For deeper context on how this dynamic specifically applies to founder budget decisions, see our 2026 marketing budget reality check.
See what your Content ROI could be this year
How to read each channel honestly
The diagnostic isn't "trust everything for 90 days." It's "know which signal each channel produces honestly in which time window, and stop reading the wrong signal at the wrong time."
The signal-by-channel framework I use:
Channel | Trustworthy signal at 30 days | Trustworthy signal at 90 days | Trustworthy signal at 6 months |
|---|---|---|---|
Content/SEO | Indexation rate | Branded query growth, ranking distribution | Non-branded impressions, citations, pipeline contribution |
Paid acquisition | CTR (early) | CPL, conversion volume | True CAC, LTV:CAC, payback |
Social organic | Engagement rate | Follower growth, audience composition | Self-reported "where did you hear about us" lift |
List growth, deliverability | Click-to-meaningful-action rate | Cohort conversion, attributed revenue | |
Podcasts | Download distribution | Subscriber retention | Self-reported attribution at demo stage |
Brand/PR | Mention volume | Branded search lift | Revenue and CAC reduction across other channels |
Read the column that matches your time window. Not the column you wish you could read.
If you're 30 days into a content program and looking at "non-branded impressions," you're reading the wrong signal at the wrong time. Same data, wrong question.
For more on the specific KPIs that matter at different stages, see our 15 essential SaaS metrics every founder must track in 2026 piece and how to track AI citations and measure GEO success.
What this looked like at Averi
I'll use our content engine as the worked example because that's the case study with the most receipts attached.
The pieces that produced the biggest impact at Averi weren't the ones that looked like winners in their first 30 days. They were the ones that quietly compounded for 90-150 days before the data caught up.
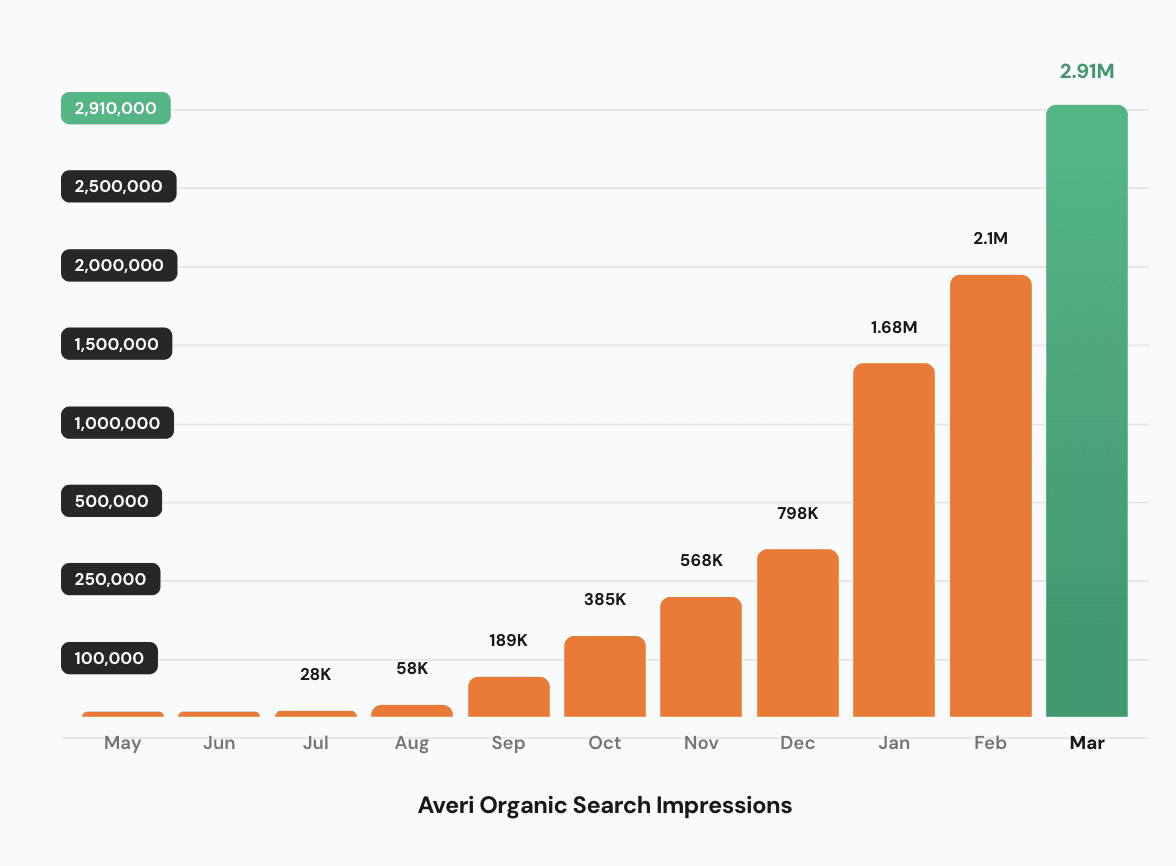
Our actual month-by-month from Search Console:
Month | Impressions | Daily avg |
|---|---|---|
April 2025 (3 days) | 1,130 | 377 |
May 2025 | 17,824 | 575 |
June 2025 | 25,057 | 835 |
July 2025 | 39,059 | 1,260 |
August 2025 | 71,685 | 2,312 |
September 2025 | 198,256 | 6,609 |
October 2025 | 381,710 | 12,313 |
If I'd judged the workflow at the 30-day mark, I'd have killed it.
May closed at 575 daily impressions on a brand-new domain.
The CTR was tiny. The keyword distribution looked random. By every short-window metric, the program was failing.
But the 90-day check was different.
By August, we had 71,685 monthly impressions — a 4x increase from May.
Still small in absolute terms.
But the pattern was clear: the work was compounding, just slowly enough that the weekly dashboard couldn't see it.
Then September happened.
Impressions jumped 2.77x in a single month. October another 1.93x. The pieces I'd published in May-July, the ones that looked like they weren't working, were exactly the pieces that produced September's traffic.
If I had killed the workflow in month 3 because it "wasn't working," I would have killed the work that produced 16,261% growth.
The full breakdown is in our 10M Impressions case study — including the specific failure modes I avoided and the moments where I almost pulled the plug.
This pattern isn't unique to content. It's how every channel with a real compound mechanic works.
The number of paid campaigns I've seen killed in week 6 because "CAC is rising" — when CAC was actually stabilizing to its real number after the first-month novelty effect ran out — would fund a small cohort of paid acquisition consultants.
Common 90-day-lie mistakes founders make
Five patterns I see most often:
Mistake 1: Watching weekly dashboards for monthly trends. A 7-day rolling window on a 90-day signal cycle is the fastest path to bad decisions. The week-to-week variance is noise, not data. Move all marketing channel reviews to a monthly cadence minimum.
Mistake 2: Comparing channels that have different honesty horizons. Comparing paid (30-day honest) and content (180-day honest) on the same dashboard at month 2 will always make content look broken. They're operating on different timescales. Compare paid to paid, content to content.
Mistake 3: Killing channels in budget cuts before the lag plays out. When a budget cut happens at month 4, the channels with the longest honesty horizons (brand, content, podcast) lose first because they have the least visible impact in the dashboard. The channels with the worst long-term economics survive because they look like they're working in the short window. Six months later, blended CAC rises and nobody knows why.
Mistake 4: Switching tools every 30 days because data looks bad. Each tool switch resets the lag clock. New attribution tool, new tracking pixel, new content scoring system — every change introduces a 60-90 day re-baseline period before the data is comparable. Founders who switch tools quarterly never accumulate enough comparable data to evaluate anything.
Mistake 5: Ignoring self-reported attribution. 30-50% of pipeline originates from channels digital attribution cannot see. A simple "how did you hear about us" question on demo signup forms surfaces this hidden signal. Most founders skip it because it feels low-tech. It's the highest-value attribution data you'll collect.
What to do this week
If you're 30, 60, or 90 days into a new marketing channel and the dashboard is making you nervous, here's the order of operations:
Identify the honesty horizon for each channel you're running. Use the table above. Write down which signal you should be watching for each channel at the current time window.
Switch every dashboard view to monthly cadence. Weekly views on long-cycle signals create panic that drives bad decisions. Move marketing reviews to once-a-month.
Audit your attribution windows. Most platforms default to 30-day windows; B2B sales cycles run 84-180 days. Extend your attribution windows to 1.5x your average sales cycle minimum. If your sales cycle is 90 days, set the window to 135. If it's 120 days, set it to 180.
Add self-reported attribution at the demo stage. One question on the form: "How did you hear about us?" Read the answers monthly. The patterns will surface 30%+ of the pipeline your dashboards are missing.
Stop comparing channels with different honesty horizons. Don't put paid and content side-by-side at month 2. Don't compare brand to social at month 4. Each channel needs its own time-appropriate review.
Resist the budget-cut reflex in months 3-4. This is the danger zone. The channels with the longest honesty horizons are the ones most likely to get cut, and they're often the ones doing the most actual demand creation work. Wait until month 6 minimum before making cut decisions on long-cycle channels.
Document your channel kill criteria in advance. Write down, before you start a channel, what failure looks like and at what time window. "If I don't see X by month 6, I cut the channel." Having criteria in writing prevents the in-month panic decision.
That's the 90-day lie diagnostic. Run it once a quarter. The compound is real. The dashboards just lag the reality.
If you want this baked into your stack — content engine, scoring, GSC + GA + AI citation tracking unified, calibrated for the realistic timeline rather than the founder-anxiety timeline — start a free 14-day Averi trial. 30 minutes to set up. First piece scored and published within the week.
Related Resources
The Diagnostic & Measurement Layer
Real Receipts
Channel-Specific Content
Founder Marketing Reality
Strategic Context
Read the right signal at the right time. Averi's Analytics layer surfaces the metrics that matter at each stage of your content engine — calibrated for the realistic timeline, not the founder-anxiety timeline. $99/mo, no contract, 14-day free trial. Start your free trial →
FAQs
Why does my marketing look broken even though I'm executing the plan?
Because most marketing channels lie to you in the first 90 days, and the channels that lie tell different lies. Content marketing and SEO understate early performance because rankings haven't consolidated yet. Paid acquisition overstates early performance because audiences are fresh and ads are novel. Social shows engagement without revenue attribution. Brand work doesn't show up in dashboards at all. The 30-day view systematically misrepresents what's actually happening.
How long should I wait before declaring a marketing channel a failure?
Each channel has its own honesty horizon. Paid acquisition reveals true CAC at 60-90 days. Content marketing and SEO take 90-120 days minimum, 6 months for full diagnostic. Social organic takes 60 days for engagement signal, 6 months for revenue impact. Email needs 4-6 months. Brand and PR take 6+ months. Killing a channel before its honesty horizon is the most expensive mistake in B2B SaaS marketing.
Why is my paid acquisition CAC rising over time?
Because the first 30-60 days of any paid campaign show inflated performance from fresh audiences and novel ads. By day 90, audience fatigue and saturation kick in, and the actual unit economics emerge. The "rising CAC" pattern in months 2-3 isn't usually a campaign failure — it's the channel reverting to its true performance after the early novelty effect runs out.
What's the average B2B SaaS sales cycle and why does it matter?
The average B2B SaaS sales cycle is 84-180 days depending on segment. It matters because 73% of B2B organizations use 30-day attribution windows, which means every touchpoint older than 30 days gets zero credit. For a 120-day cycle, that's 75% of the buyer journey erased from the dashboard. Set your attribution window to at least 1.5x your average sales cycle to capture the actual journey.
How do I tell if a channel is in dark funnel or actually broken?
Add self-reported attribution at the demo or trial signup stage — one question, "how did you hear about us?" If the channel keeps showing up in self-reported attribution while the digital dashboard shows zero, it's dark funnel and the channel is working. If neither digital nor self-reported attribution credits the channel after 6 months, it's broken. 30-50% of B2B pipeline originates from channels digital attribution cannot see, so self-reporting is essential.
Should I use last-touch or multi-touch attribution for B2B SaaS?
Multi-touch — specifically a position-based or W-shaped model. The average B2B deal involves 7.3 marketing touchpoints; single-touch attribution credits 1 of 7, leaving 86% of the journey uncredited. Position-based attribution (40% to first touch, 40% to last touch, 20% distributed across middle) is the strongest starting point. Last-touch is still the default in 35% of B2B SaaS organizations, but it systematically over-credits bottom-funnel channels and under-credits the awareness work that creates demand.
How does Averi help diagnose marketing channel performance?
Averi's Analytics layer ties Google Search Console, Google Analytics, and AI citation tracking into a unified view with decay detection that flags pieces showing trending-down impressions. The Strategy Map identifies tier-2 vs tier-4 imbalance in your content library, the Content Scoring System evaluates whether new pieces meet the 80+ composite threshold before publish, and the Refresh queue surfaces specific actions to take. The result: a content channel diagnostic that runs continuously rather than as a quarterly panic.