We Ran 50 B2B SaaS Queries Through Google AI Mode. It Cited 23 Sources Per Answer.

6 minutes

TL;DR
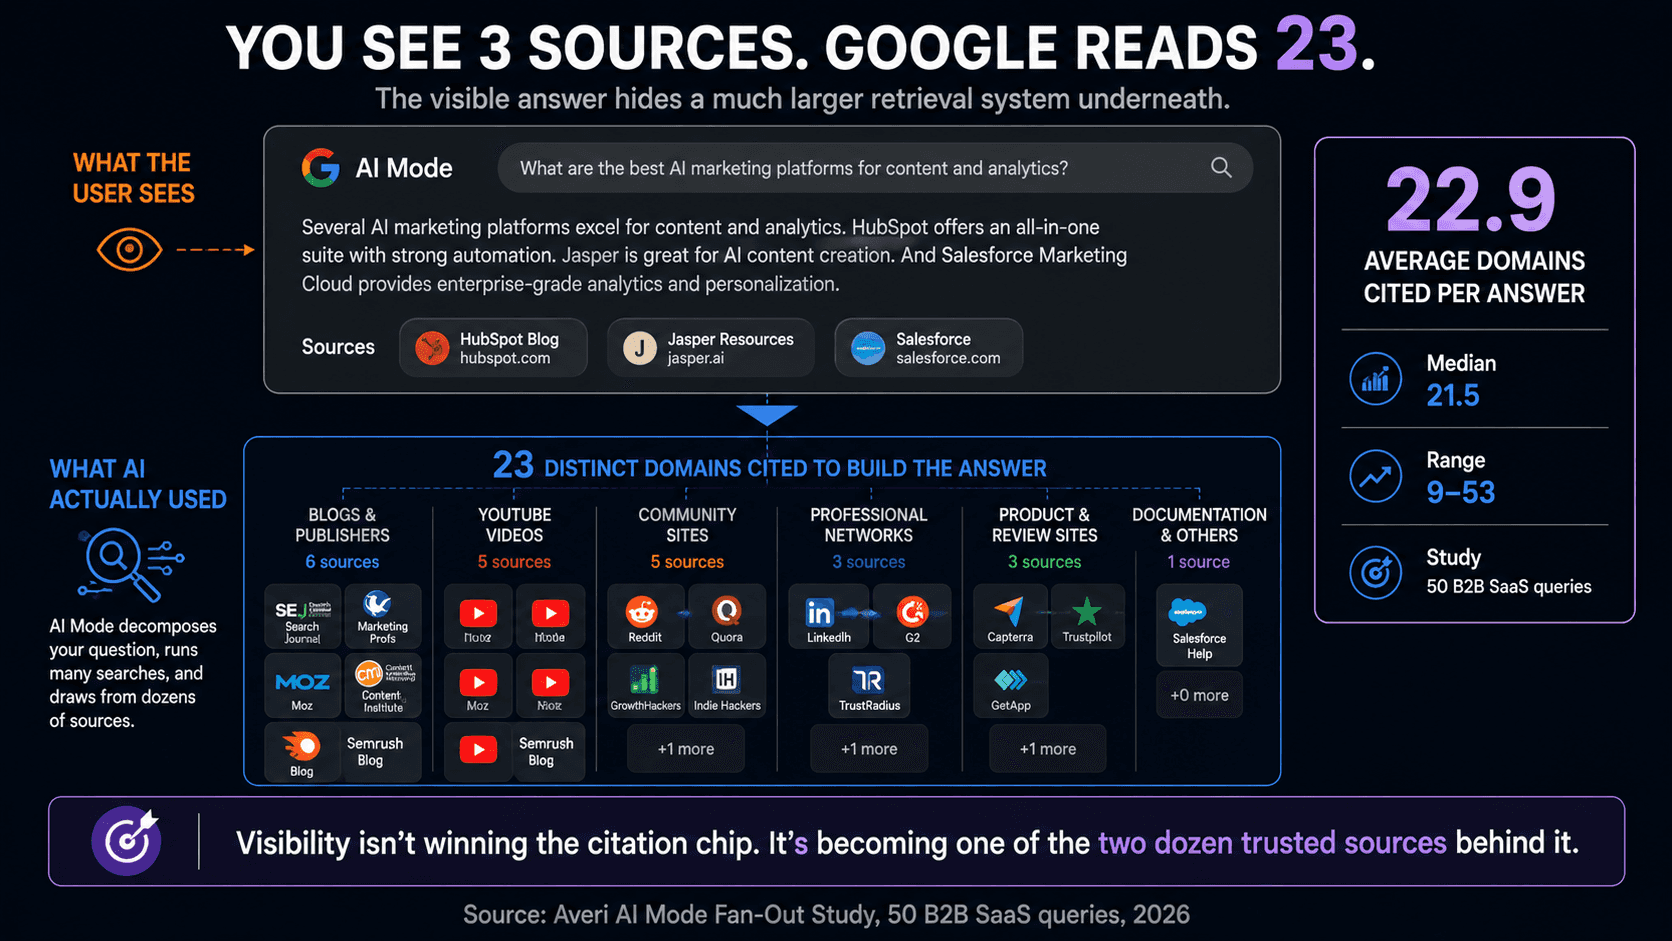
📊 Across 50 B2B SaaS queries, Google AI Mode cited an average of 22.9 distinct domains per answer (median 21.5, range 9 to 53).
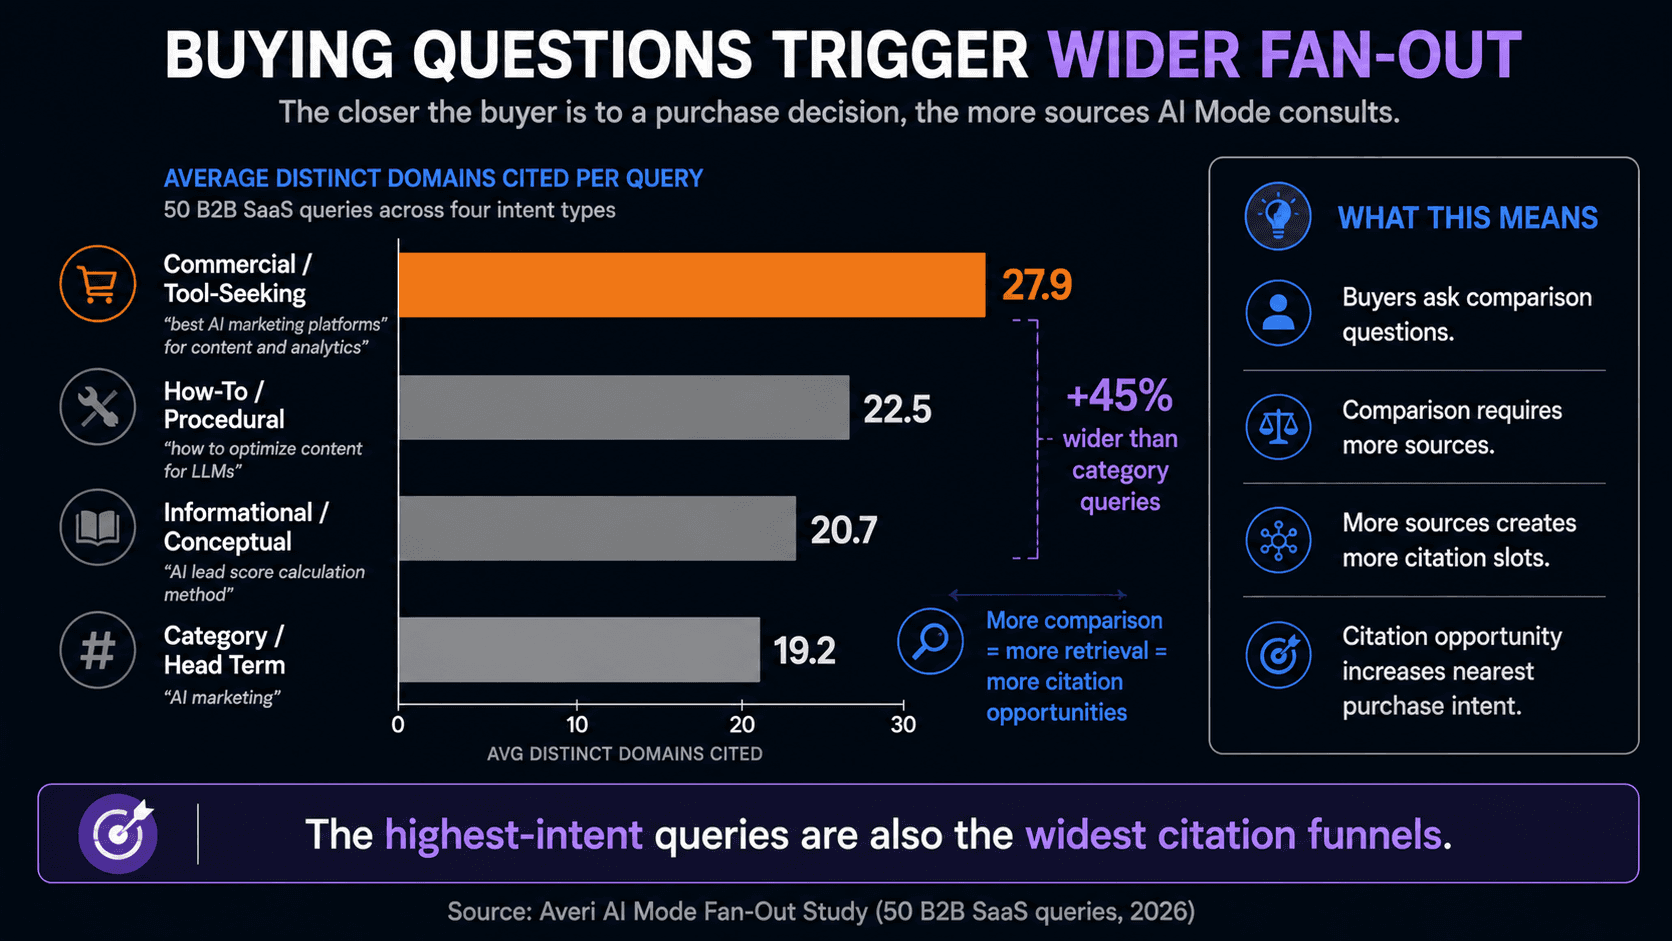
📈 Fan-out breadth scales with commercial intent: tool-seeking queries pulled 27.9 sources on average versus 19.2 for broad category terms — about 45% wider.
📺 YouTube was the single most-cited domain (appearing in 38% of queries), followed by Reddit (22%) and LinkedIn (20%). Wikipedia barely registered (2%).
🏷️ Our own domain, averi.ai, appeared in 40% of the queries we ran and was the 7th most-cited domain overall — ahead of Salesforce, IBM, and G2.
📁 The full 50-query dataset is downloadable so you can verify the findings or reproduce the method on your own queries.

Zach Chmael
CMO, Averi
"We built Averi around the exact workflow we've used to scale our web traffic over 6000% in the last 6 months."
Your content should be working harder.
Averi's content engine builds Google entity authority, drives AI citations, and scales your visibility so you can get more customers.
We Ran 50 B2B SaaS Queries Through Google AI Mode. It Cited 23 Sources Per Answer.
Google AI Mode pulls from an average of 23 different websites to answer a single B2B SaaS question, and the number climbs the closer the question gets to a buying decision. That is not an estimate or a vendor claim. We ran 50 of our own priority queries through AI Mode, recorded every source it cited, and counted.
The flagship argument behind this study is simple: the company that understands how AI agents gather sources will own the next era of search visibility. That thesis needed proof, not assertion. So we built the dataset.
This piece is the receipts: the full methodology, the headline numbers, the patterns by query type, and a downloadable copy of all 50 results so you can check our work or rerun it yourself.
Most writing about query fan-out describes the mechanism in the abstract. We wanted the numbers from real B2B SaaS queries, measured the same way every time. Here is what we found.
What is query fan-out, and what did we actually measure?
Query fan-out is the technique where an AI search engine breaks one question into multiple related sub-searches, runs them in parallel, and synthesizes the results into a single answer. Google confirms that both AI Mode and AI Overviews may issue multiple related searches across subtopics and data sources to build a response. The scale of decomposition is real: iPullRank's research with SimilarWeb found AI search queries average about 70 to 80 words versus 3 to 4 for traditional Google search, a step-change in complexity that forces the engine to split one question into many. One question becomes a dozen searches, and a dozen searches pull from many more sources.
We measured the output side of that process: the citation footprint. For each of 50 queries, we recorded how many distinct domains AI Mode cited to assemble its answer, which specific domains appeared, and whether our own content showed up. We did not attempt to capture the verbatim internal sub-query strings, because Google does not expose those to users.
What we captured is the thing that actually matters for visibility: when AI Mode answers a buyer's question, whose content does it pull from, and how many sources does it consult?
This distinction matters for honesty.
A lot of fan-out content claims to reveal the "exact sub-queries" an engine runs. Unless someone has privileged access to Google's internals, that is reconstruction, not measurement.
We measured what is observable: the sources cited. That is enough to draw real conclusions.
How was the study built?
The study used 50 queries pulled from our own Google Search Console data, curated for relevance and balanced across four intent types. We did not invent the queries. Each one is a real search that already drives impressions to our site, which means the results describe the actual competitive environment we operate in, not a hypothetical one.
We grouped the 50 into four intent buckets: 15 commercial or tool-seeking queries ("what is the best AI tool for content marketing"), 12 informational queries ("AI lead score calculation method"), 12 broad category head terms ("AI marketing," "zero click search"), and 11 how-to queries ("how do I track my visibility in ChatGPT").
The balance was deliberate. The point was not just to get an average, but to see whether fan-out behaves differently depending on what kind of question is asked.
Each query was run once through Google AI Mode in a clean session, and we recorded the citation data by hand. One run per query is a snapshot, not a longitudinal average, and we are explicit about that limitation below. The full dataset, including the query list and per-query results, is published alongside this piece so the method is fully reproducible.
How many sources does Google AI Mode actually cite per query?
Google AI Mode cited an average of 22.9 distinct domains per query across our 50-query set, with a median of 21.5 and a range from 9 to 53. That is the headline finding, and it is larger than most people assume.
When a buyer asks AI Mode a single question, the answer they read is synthesized from roughly two dozen sources, blended into a few paragraphs with a handful of visible citation chips.
The gap between what the user sees and what the engine consulted is the entire strategic story. A searcher reads one tidy answer and maybe three linked sources. Behind that answer, AI Mode evaluated and drew from twenty-plus. Your content does not need to be the one visible link to influence the answer. It needs to be one of the two dozen sources the engine trusts enough to pull from. That is a wider funnel than ranking number one, and a different game entirely.
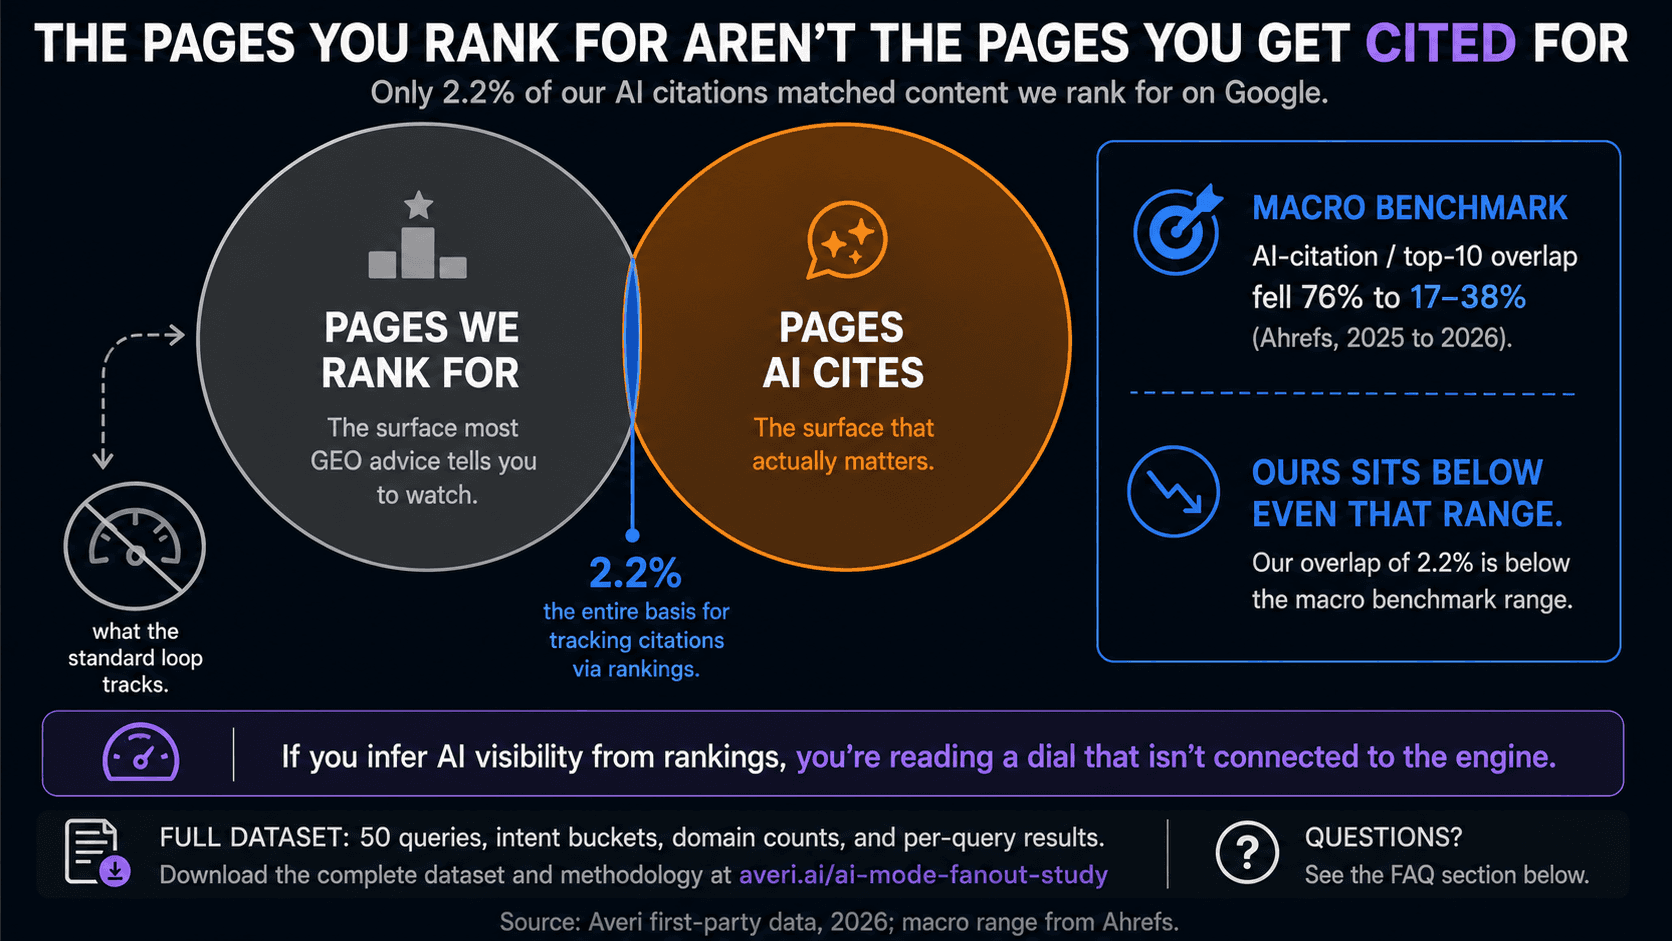
This reconciles with the public research. The Surfer study found that about 68% of pages cited in AI answers were not in the organic top 10 for the main query, evidence that the engine is pulling from a wide, distinct source pool rather than just the top-ranking results. A wide citation footprint per query is exactly what produces that pattern, and it is exactly what our measured average of roughly two dozen domains describes.
Does fan-out get wider for high-intent queries?
Yes, and this is the most actionable finding in the study. Fan-out breadth scaled directly with commercial intent. Tool-seeking queries pulled the most sources; broad category terms pulled the fewest.
The averages by intent type:
Intent type | Avg domains cited | Example query |
|---|---|---|
Commercial / tool-seeking | 27.9 | "best AI marketing platforms for content and analytics" |
How-to / procedural | 22.5 | "how to optimize content for LLMs" |
Informational / conceptual | 20.7 | "AI lead score calculation method" |
Category / head term | 19.2 | "AI marketing" |
Commercial queries fanned out about 45% wider than category head terms.
That makes intuitive sense: when someone is comparing tools to buy, AI Mode has to evaluate many candidates, so it consults many sources. When someone types a broad category term, the engine returns a more general answer from fewer references.
The implication for a B2B SaaS company is direct. The queries where buyers are closest to a purchase decision are exactly the queries where AI Mode casts the widest net for sources.
That pattern holds beyond our data: SE Ranking found commercial queries are roughly 13 times more likely to trigger AI Mode's shopping and comparison features than general searches. High commercial intent means more retrieval, which means more open citation slots. If you are going to engineer content for AI citation, start with your commercial, comparison, and "best tool for" queries, because that is where the fan-out is widest and the buyer is warmest.
Who actually gets cited in B2B SaaS answers?
User-generated and video platforms dominated the sources AI Mode pulled, not the traditional authority sites most SEO playbooks chase. Across all 50 queries, YouTube was the single most-cited domain, appearing in the top sources for 38% of queries. Reddit followed at 22% and LinkedIn at 20%. Instagram and Medium each appeared in over 10%.
The surprise was Wikipedia.
Conventional GEO wisdom holds that Wikipedia and Reddit are the twin pillars of AI citation. In our B2B SaaS query set, Reddit held up but Wikipedia appeared in just one of 50 queries. For B2B software questions specifically, AI Mode leaned on video walkthroughs, community discussion, and professional-network content far more than on encyclopedic reference.
Our finding matches independent data: SE Ranking's 2025 analysis of AI Mode responses also found Wikipedia, Reddit, and YouTube among the top-cited domains, with YouTube and community sources featuring heavily. This also matches the broader pattern that AI citations overlap only marginally with the organic top 10, but the specific dominance of video and community content in B2B is worth planning around.
The practical read: if you are a B2B SaaS company optimizing only your owned blog and ignoring YouTube, Reddit, and LinkedIn, you are absent from the source pool AI Mode draws on most. A citation strategy that lives entirely on your own domain is fishing in the smallest pond.
And the pool itself churns constantly: SE Ranking found over 60% of domains and 80% of URLs disappear between AI Mode runs even for the same user, city, and query. Being one of many trusted sources, refreshed often, beats betting on a single page holding a single slot.
How often did our own content get cited?
Our domain appeared in 40% of the 50 queries, split between 16% where averi.ai showed up in AI Mode's linked sources and 36% where Averi was named in the answer text.
Across all 50 queries, averi.ai was the 7th most-cited domain overall, ahead of Salesforce, IBM, and G2.
We are sharing our own number for two reasons.
First, transparency: a study that publishes a citation-rate finding should disclose its own.
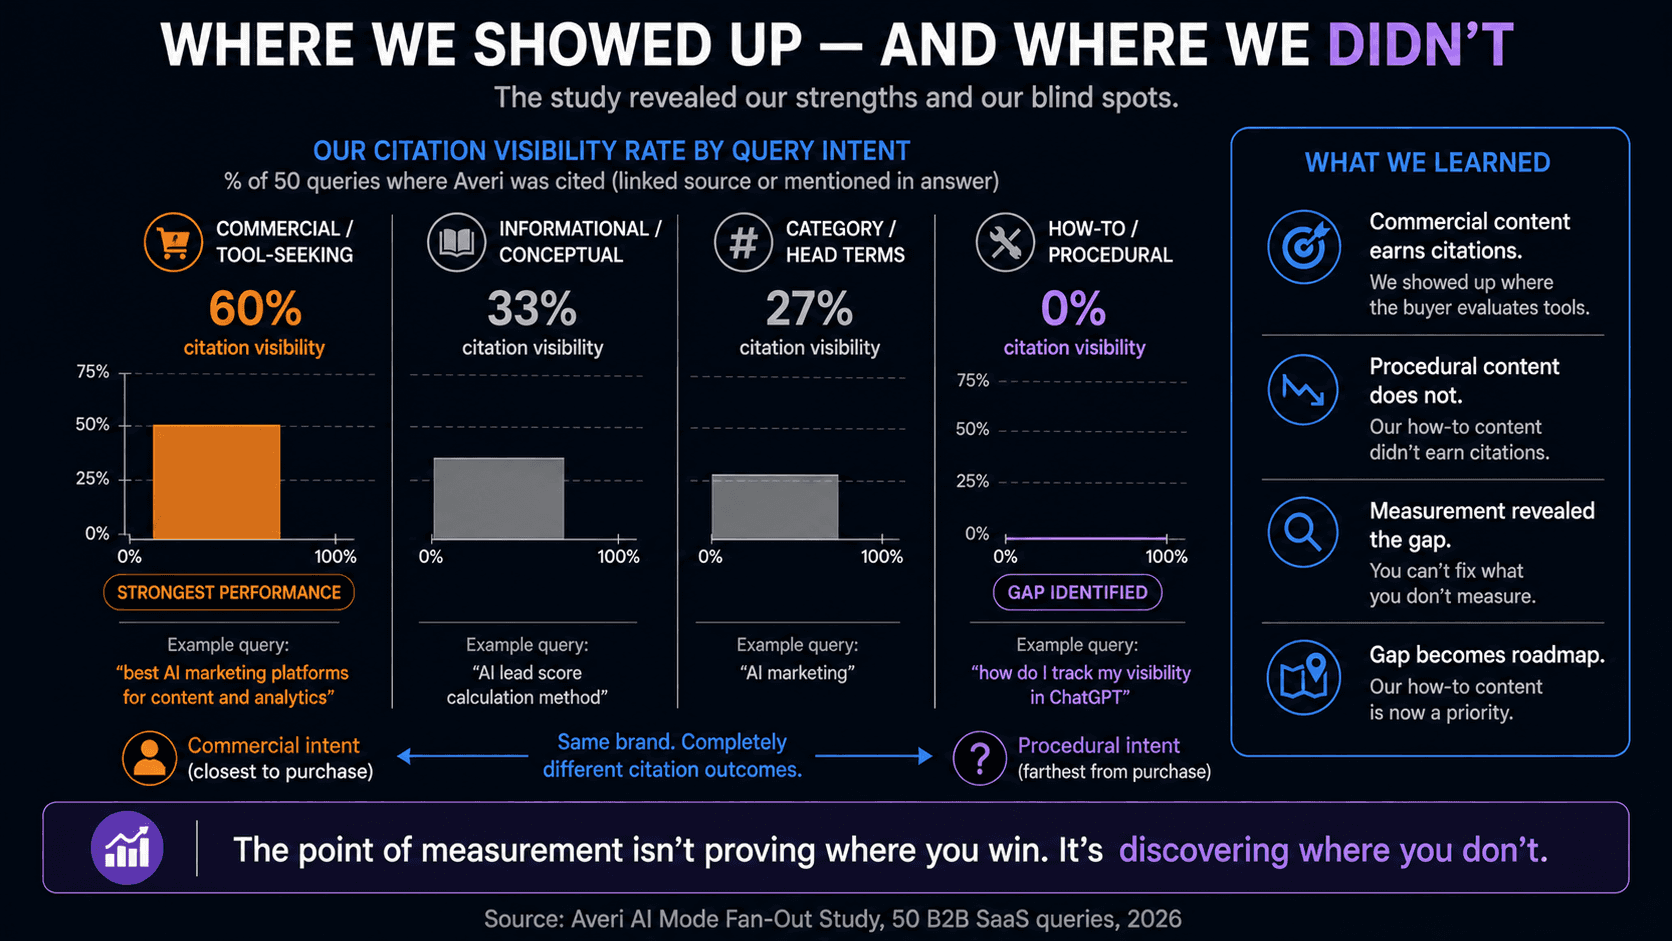
Second, the distribution is the interesting part. Our strongest visibility came on commercial, tool-seeking queries, where Averi was mentioned in 60% of answers, versus 0% on the how-to queries we tested.
That is the citation footprint paying off precisely where buying intent is highest, and a clear signal of where the gaps are: our how-to and procedural content is not yet earning citations the way our commercial content is.
That is not a victory lap. It is a diagnostic. The same study that shows where you win shows where you do not, and the how-to gap is now on our roadmap.
What are the limits of this data?
This is a single snapshot from a single collector, run once per query, and AI Mode output varies by session and over time. We want to be precise about that, because overstating a 50-query snapshot would undercut the whole point of publishing the method.
Three specific caveats:
First, fan-out is unstable. A Surfer SEO study of 173,902 URLs found only about 27% of fan-out sub-queries stay stable across repeated searches, meaning the specific sources cited can shift run to run. Our single-run design captures a point in time, not a stable average. The direction of the findings (wide fan-out, intent scaling, UGC dominance) is more reliable than any single per-query number. The same study found a strong 0.77 correlation between the number of fan-out queries a page ranks for and its odds of being cited, with pages ranking for fan-out queries 161% more likely to be cited than those ranking for the main query alone.
Second, this is one person's session. Personalization, location, and account state all influence AI Mode, so your results will differ. That is why we published the query list: so you can run it yourself and compare.
Third, 50 queries is enough to surface clear patterns but not to claim statistical precision. Treat the averages as directional. The instability of fan-out is itself the strategic lesson, because 73% of sub-queries change between runs, broad topical depth beats optimizing for any specific predicted sub-query. You cannot target a moving set of sub-queries. You can only cover a topic thoroughly enough to get pulled regardless of which ones fire. Surfer's own conclusion from the data was the same: own the topic rather than chasing individual fan-outs.
What should a B2B SaaS team do with this?
Build for breadth of citation, not depth of ranking, and start where the fan-out is widest.
The data points to four concrete moves:
Prioritize commercial and comparison queries. They fan out widest (27.9 sources) and sit closest to a purchase. These are your highest-value citation targets.
Earn a presence on YouTube, Reddit, and LinkedIn. They are the most-cited domains in B2B SaaS answers. Owned-blog-only strategies miss the largest part of the source pool.
Go broad and deep on topics, not narrow on sub-queries. Because most sub-queries change between runs, deep topical coverage is what gets you pulled regardless of which sub-queries fire on a given day.
Measure your own citation footprint. Search Console does not break out fan-out, so you need your own measurement layer. Run a fixed set of priority queries through AI Mode on a schedule and track which sources, including yours, get cited.
That fourth point is the whole discipline in miniature. You cannot manage what you do not measure, and Google does not hand you this data. We built our own measurement layer to run this study. It is the same instinct behind running a content engine on first-party signals rather than guesswork.
If building that measurement layer by hand sounds like work, it is. Averi scores your existing pages against the SEO and GEO signals that decide citation so you can see your gaps without running 50 queries by hand first. Start with your commercial pages, where the fan-out is widest.
The Averi angle
This study is what the Averi content engine does as a matter of routine: measure the real citation environment, find the gaps, and build toward them. We ran 50 queries by hand for this piece so the methodology would be transparent and reproducible. Inside the product, that measurement and gap analysis is the workflow, not a one-time research project.
The finding that should stick is the one about where we are not cited. Our commercial content earns citations; our how-to content does not yet. We know that because we measured it. Most teams are flying blind into AI search because they have never built the measurement layer to see their own citation footprint.
If you want to see where your content stands in the source pool AI Mode draws from, score your pages for SEO and GEO readiness in Averi and find your citation gaps before your competitors fill them. It is a 14-day free trial. Solo is $99/mo.
FAQs
How many sources does Google AI Mode cite per answer?
In our 50-query B2B SaaS study, Google AI Mode cited an average of 22.9 distinct domains per answer, with a median of 21.5 and a range of 9 to 53. The user typically sees only a few linked sources, but the engine consults roughly two dozen to synthesize each answer. The exact number varies by query complexity and session.
What is query fan-out in Google AI Mode?
Query fan-out is the technique where AI Mode breaks one question into multiple related sub-searches, runs them in parallel, and synthesizes the results into a single answer. Google confirms AI Mode and AI Overviews may issue multiple related searches across subtopics. Independent analysis estimates AI Mode generates roughly 8 to 12 sub-queries per question.
Do high-intent queries trigger wider fan-out?
Yes. In our study, commercial and tool-seeking queries cited 27.9 domains on average, about 45% more than the 19.2 cited for broad category head terms. The closer a query sits to a purchase decision, the more sources AI Mode consults, because comparison and evaluation require drawing from many candidates.
Which websites does Google AI Mode cite most for B2B SaaS?
In our B2B SaaS query set, YouTube was the most-cited domain (38% of queries), followed by Reddit (22%) and LinkedIn (20%). Wikipedia appeared in only 2%, a notable departure from the common assumption that Wikipedia dominates AI citations. Video and community content led for B2B software questions.
Is fan-out data stable enough to optimize for?
Only partly. A Surfer SEO study found just 27% of fan-out sub-queries stay stable across repeated searches, so the specific sources cited shift run to run. The practical implication is to build broad topical coverage rather than targeting specific predicted sub-queries, since you cannot reliably target a moving set.
How can I measure my own AI Mode citation footprint?
Google Search Console does not break out fan-out or AI Mode citations separately, so you need your own measurement layer. Run a fixed set of priority queries through AI Mode on a regular schedule, record which domains get cited including your own, and track changes over time. This is the method we used for this study.
Can I see the full dataset behind this study?
Yes. The complete 50-query dataset, including the query list, intent classification, domain counts, and per-query citation results, is published as a downloadable companion file so you can verify the findings or reproduce the method on your own queries.
Related Resources
The fan-out thesis and the agentic web
Get cited, measured and structured
How to Track AI Citations and Measure GEO Success: The 2026 Metrics Guide
Platform-Specific GEO: ChatGPT vs Perplexity vs Google AI Mode
Building Content That AI Agents Will Recommend: The 2026 Technical Guide for B2B SaaS
Answer Capsules: 40–60 Word Patterns That Turn H2s into Citations
The engine behind the method