The Weekly AI Visibility Report: A 90-Minute Template for Startup Teams

5 minutes

TL;DR
🎯 A weekly AI visibility report is a fixed-structure deliverable that packages citation rate, Brand Visibility Score, AI share of voice, and AI-referred traffic metrics into one document every Monday. It's the operational artifact that converts AI visibility measurement into editorial decisions and budget justification.
⏱️ The 90-minute time budget: 45 min running prompts across 4 engines, 20 min logging and calculating, 15 min writing narrative, 10 min distribution. This is the sustainable weekly cadence — less and the data is stale, more and operators burn out.
📋 6 required sections: headline summary, BVS movements, citation rate by platform, AI share of voice vs. competitors, attribution and traffic, editorial priorities for next week. Every section answers a specific question. Missing sections break the report's purpose.
👥 3 audiences, 3 framings: self/content team (tactical, long form), CMO/leadership (summary, ROI-focused), board/investors (monthly rollup, trend + benchmark). Same data, different packaging.
📈 The executive takeaway pattern: one sentence at the top of every report that converts AI visibility into dollars. "AI-referred traffic grew X% and converts at Y% vs. Z% for [comparison channel]." Delivered weekly for 6-8 weeks, this sentence changes how leadership thinks about the program.

Zach Chmael
CMO, Averi
"We built Averi around the exact workflow we've used to scale our web traffic over 6000% in the last 6 months."
Your content should be working harder.
Averi's content engine builds Google entity authority, drives AI citations, and scales your visibility so you can get more customers.
The Weekly AI Visibility Report: A 90-Minute Template for Startup Teams
Measuring AI visibility without a weekly report is vibes-based analytics.
You run the prompts, log the data, maybe notice something interesting — and then Monday hits and it's gone. No editorial decisions get made. No content gets prioritized. No leadership conversation happens.
The measurement might as well not have happened.
The fix is packaging. Every week, the same 6-section report, built from the same inputs, answering the same questions.
That package is what turns AI visibility from a research project into an operational discipline. It's also what turns the measurement work into budget justification — the CMO who sends a weekly AI visibility report that shows "AI-referred traffic grew 15% this month, converting at 14% vs. 3% for Google Organic" gets AI visibility budget. The one whose measurement lives in scattered spreadsheets doesn't.
This piece is the template.
The 90-minute time budget that makes the weekly cadence sustainable. The 6-section structure that packages citation tracking, share of voice, attribution, and Brand Visibility Score into one coherent deliverable. The three audiences (you, leadership, board) and what each version includes. A fully annotated sample report. The editorial loop that converts weekly reports into content production priorities.
For the broader AI visibility framework this report sits inside, see The Complete Guide to AI Visibility for B2B SaaS.
What Is a Weekly AI Visibility Report?
A weekly AI visibility report is a fixed-structure deliverable that consolidates all AI visibility measurement inputs — Brand Visibility Score, citation frequency across platforms, competitive share of voice, AI-referred traffic and conversion data — into one document produced every Monday.
It's the operational artifact that turns scattered measurement work into editorial priorities, leadership updates, and defensible ROI.
Without it, AI visibility data sits in spreadsheets and dashboards that nobody reads. With it, AI visibility becomes a weekly decision-making rhythm.
Three things the report does that nothing else in the measurement stack does:
Forces synthesis. Running the prompt library produces raw data. Logging citations produces tables. The weekly report forces you to answer "what does this mean and what do we do about it." That synthesis is where the operational value lives.
Creates a shareable deliverable. Spreadsheet tabs don't get shared with leadership. Documents do. The report becomes the currency that moves AI visibility into executive conversations.
Locks in cadence. Without a weekly deliverable, measurement slips. With one, the Monday rhythm becomes unmovable because people expect the report to land.
The report is the thing that makes the measurement work.
Why Weekly (Not Daily, Not Monthly)
Weekly is the Goldilocks cadence for AI visibility reporting. Three reasons.
Daily is too noisy
AI engine responses vary meaningfully day-to-day even with identical prompts. A daily report captures noise as signal. Citation rate that swings 6-8 points in 24 hours isn't indicating trend — it's indicating prompt sampling variation. Teams running daily reports waste hours investigating non-signals.
Monthly misses optimization loops
A 4-week delay between measurement and action means optimization cycles run at 1/4 speed. Perplexity citation changes show up in 2-4 weeks. A monthly report catches the change after it's already happened and after you've missed the opportunity to double down or course-correct. Weekly catches movement as it's happening.
Weekly matches content production cadence
Most B2B SaaS teams ship content 1-4 times per week. A weekly AI visibility report matches that rhythm — every Monday's report directly informs the week's content production priorities. Monthly reports disconnect measurement from production in a way that breaks the feedback loop.
The practical cadence that works: report runs Monday morning from prior week's data. Editorial priorities for the week get set based on the report. Content ships Tuesday-Friday. Following Monday, the cycle repeats and catches any impacts from the prior week's work.
The 90-Minute Time Budget
Sustainable weekly reporting requires time-boxing. 90 minutes is the tight-but-feasible budget that produces a defensible report without burning operators out.
Activity | Time | What Happens |
|---|---|---|
Run prompt library | 45 min | Run 25-30 prompts across ChatGPT, Perplexity, Claude, Google AI Mode |
Log citations and mentions | 20 min | Record each response in tracking spreadsheet (cited?, mentioned?, placement, competitors cited) |
Calculate metrics | 10 min | BVS composite, citation rate per platform, SOV vs. competitors, pull GA4 attribution data |
Write narrative summary | 10 min | Headline, trend explanations, editorial priorities for coming week |
Distribute | 5 min | Send to team, leadership, file in shared location |
Where the time goes wrong
Most teams blow past 90 minutes in one of three ways:
Running too many prompts (50+ across 4 platforms = 90 minutes of just measurement with no time for analysis). Keep the prompt library at 25-35 prompts for sustainable weekly cadence.
Over-investigating single-week movements (spending 30 minutes trying to explain a 4-point citation rate drop that's just noise). Trust the weekly cadence and look at 4-week rolling trends.
Redesigning the report each week (reworking the structure rather than filling in a consistent template). Lock the structure for at least 90 days, then iterate.
If the 90-minute budget keeps slipping to 2-3 hours, the root cause is usually library size, not operator speed. Shrink the library before extending the time budget.
The 6-Section Report Template
Every weekly AI visibility report includes these six sections in this order.
Section 1: Headline Summary (top of the report)
One-paragraph narrative of what happened this week. The single most important sentence in the report. Pattern:
"[Metric direction] AI visibility week-over-week. BVS moved from [X] to [Y]. The driver was [specific cause]. Next week we're prioritizing [specific action]."
This is the section leadership reads. It's also what gets copied into Slack updates and executive emails. Get this sentence right and the rest of the report has context.
Section 2: Brand Visibility Score Movements
Week | BVS | Citation Rate | Brand Mention Rate | AI Share of Voice | LLM Conversion Rate |
|---|---|---|---|---|---|
Current | [X] | [X]% | [X]% | [X]% | [X]% |
Prior week | [X] | [X]% | [X]% | [X]% | [X]% |
4 weeks ago | [X] | [X]% | [X]% | [X]% | [X]% |
This is the trend-tracking backbone. BVS is the composite; the four supporting metrics let you diagnose what drove the composite movement.
Section 3: Citation Rate by Platform
Platform | This Week | Last Week | 4-Week Trend |
|---|---|---|---|
ChatGPT | [X]% | [X]% | ↑ / ↓ / → |
Perplexity | [X]% | [X]% | ↑ / ↓ / → |
Claude | [X]% | [X]% | ↑ / ↓ / → |
Google AI Mode | [X]% | [X]% | ↑ / ↓ / → |
Platform-specific tracking because only 11% of sites are cited by both ChatGPT and Perplexity. A blended number hides platform-specific failures.
Section 4: AI Share of Voice vs. Competitors
Brand | Mention Share | Citation Share | Composite SOV | Gap to Leader |
|---|---|---|---|---|
[Competitor A] | [X]% | [X]% | [X]% | — |
[Competitor B] | [X]% | [X]% | [X]% | [X] pts |
Your brand | [X]% | [X]% | [X]% | [X] pts |
[Competitor C] | [X]% | [X]% | [X]% | [X] pts |
Always sort by SOV highest to lowest. Bold your own brand. The "Gap to Leader" column focuses attention on how much ground you need to close. For the full SOV methodology, see AI Share of Voice: The Competitive Metric Most SaaS Teams Aren't Tracking Yet.
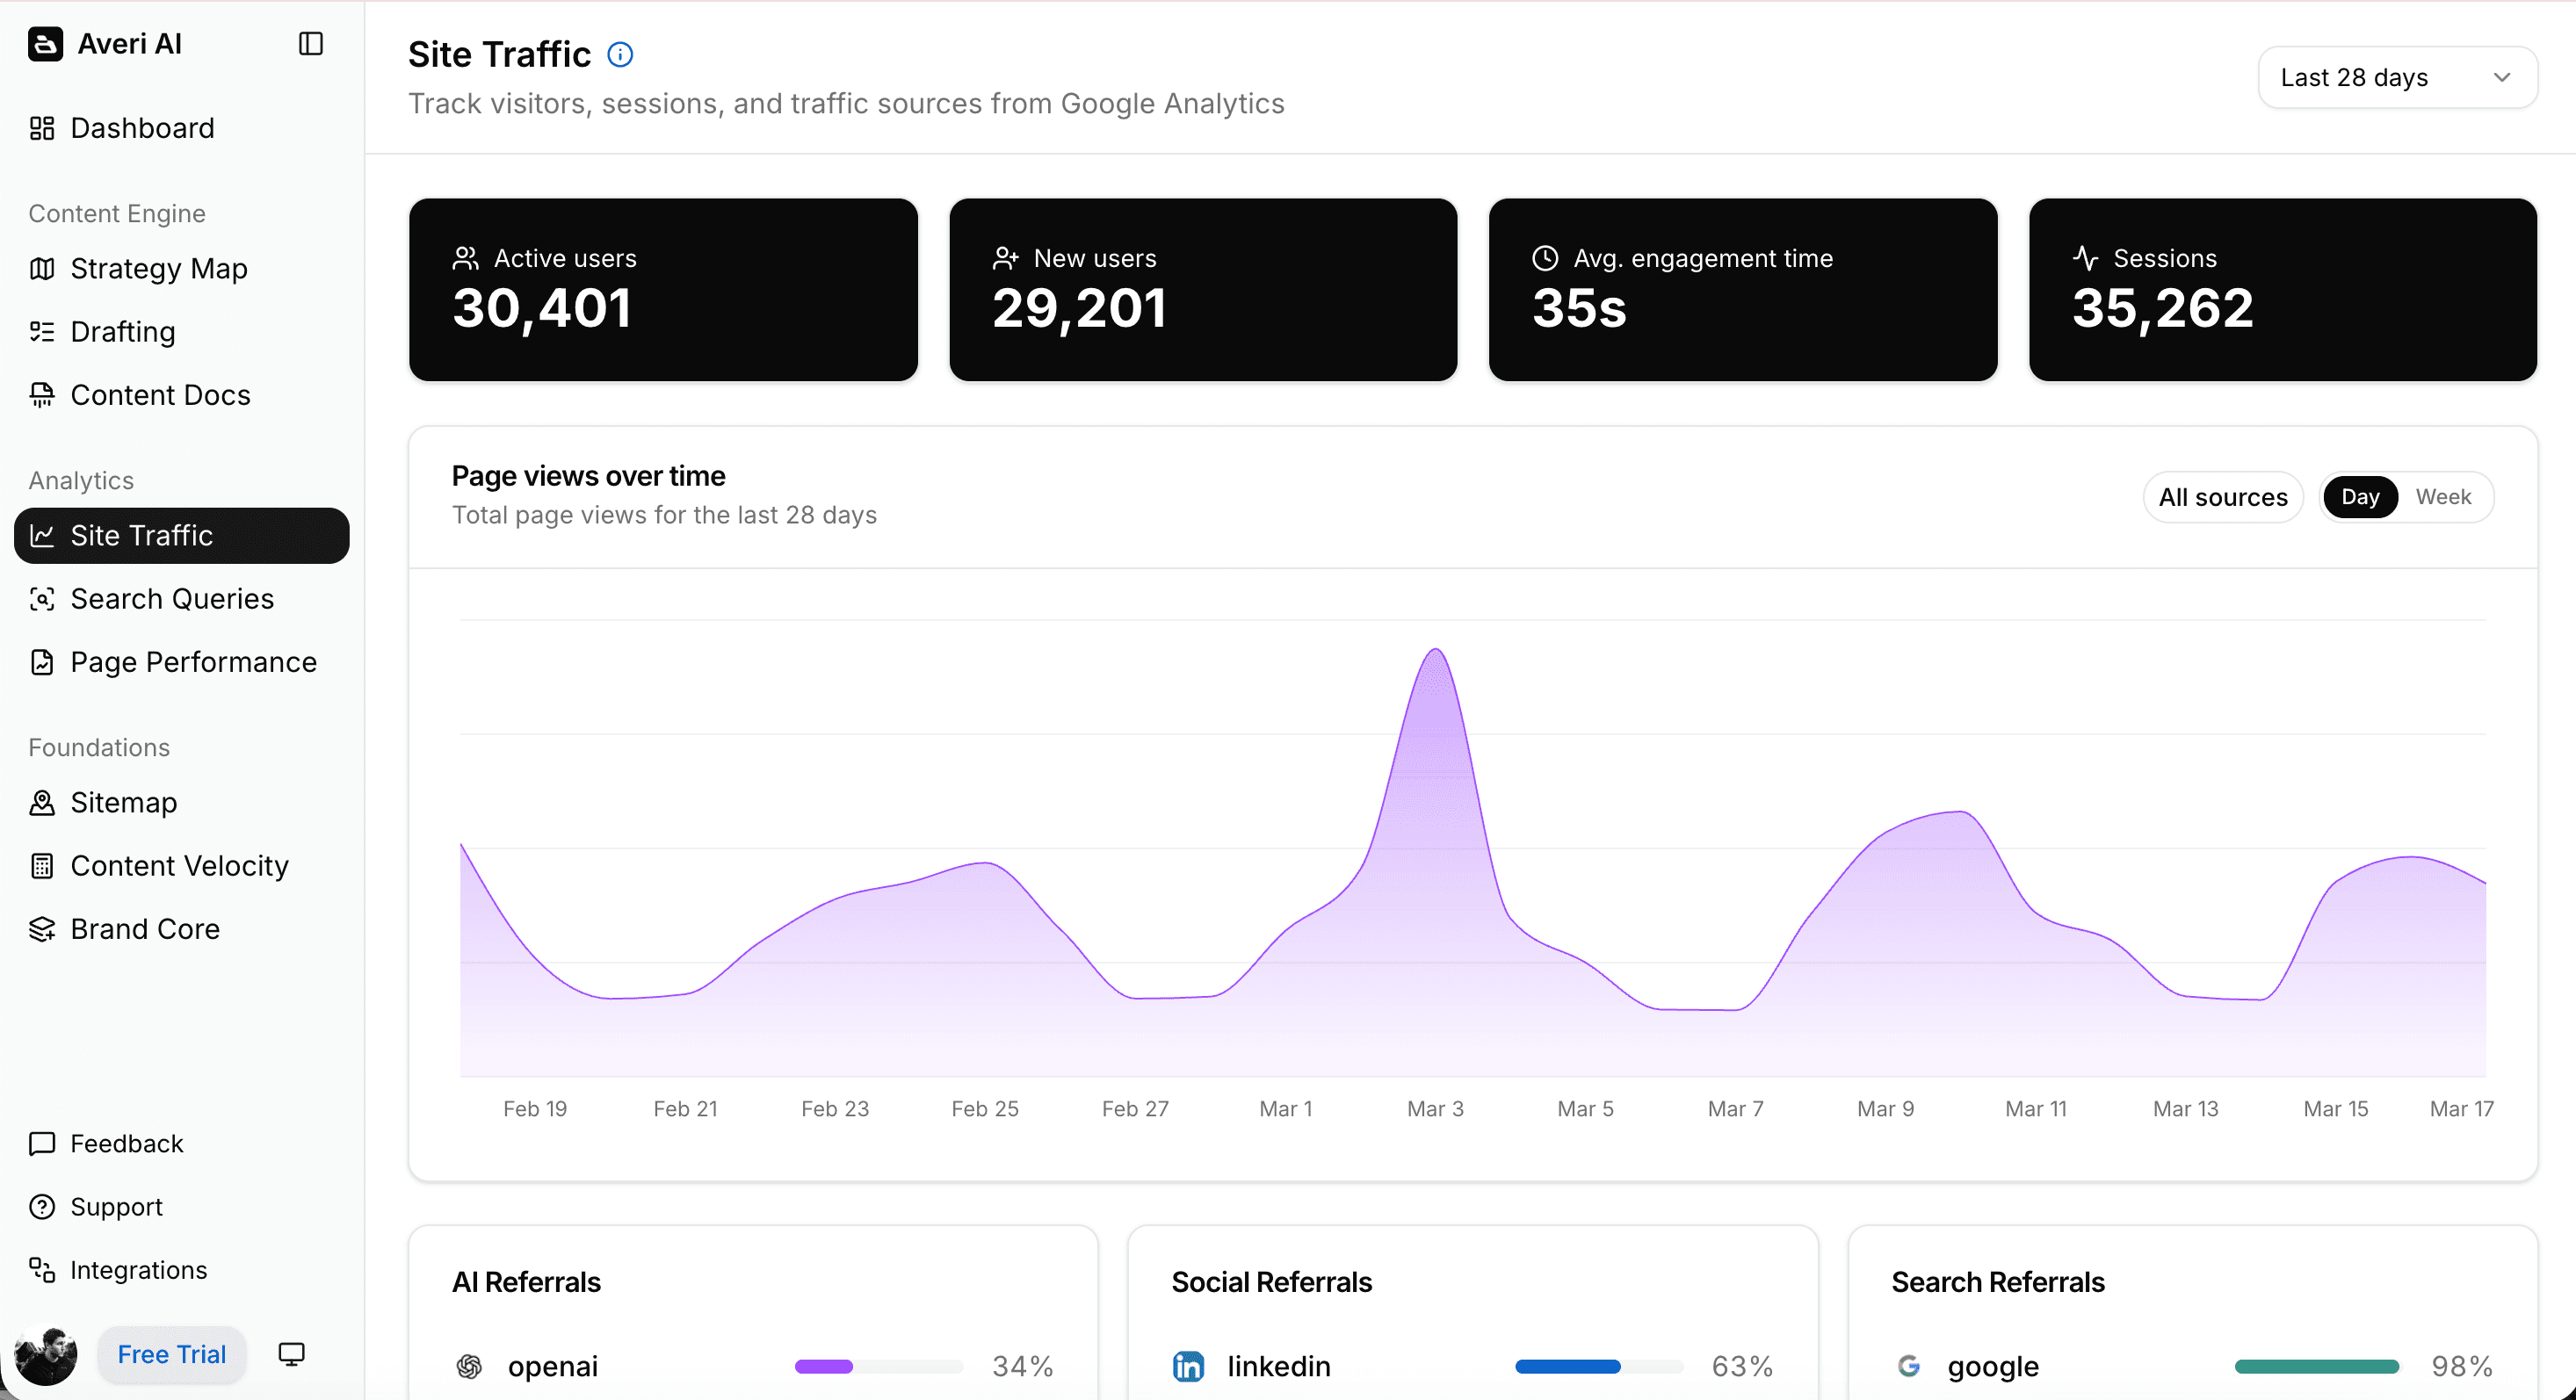
Section 5: Attribution and Traffic
Metric | This Week | Last Week | 4-Week Trend |
|---|---|---|---|
AI-referred sessions | [X] | [X] | ↑ / ↓ / → |
AI-referred conversion rate | [X]% | [X]% | ↑ / ↓ / → |
AI-inferred sessions (landing page pattern) | [X] | [X] | ↑ / ↓ / → |
Top AI-referred landing pages (top 5) | [list] | — | — |
Pulls directly from the GA4 attribution setup. This is the section that connects upstream visibility (citations, SOV) to downstream ROI (traffic, conversion, pipeline).
Section 6: Editorial Priorities for Next Week
A short bullet list of 3-5 specific actions driven by this week's data:
Refresh X high-impression pages where citation rate is flat
Publish Y new comparison piece addressing query gap identified in SOV data
Update schema on Z pages where Google AI Mode citation rate is lagging
Fix attribution gap on [specific landing pages] where Direct traffic looks anomalous
This is the section that closes the loop. Measurement without action is noise. The editorial priorities turn the report into the next week's production plan.

Who Reads the Report (3 Audiences, 3 Framings)
Same data, three different packagings for three different audiences.
Audience 1: You and the content team (tactical, long-form)
The full 6-section report. All data tables, all narrative commentary, all editorial priorities. 90-minute investment produces roughly 2-3 pages of content that drives next week's production.
Format: Shared Google Doc or Notion page. Accessible, linkable, allows comments. Not a PDF — PDFs don't get updated.
Frequency: Weekly, Monday morning.
Audience 2: CMO and leadership (summary, ROI-focused)
The headline summary (Section 1), Attribution and Traffic (Section 5), and a 3-line summary of Editorial Priorities (Section 6). Leadership doesn't need the platform-specific citation breakdown. They need: "AI visibility is moving in X direction, ROI looks like Y, we're doing Z next week."
Format: 4-5 sentence Slack update or email summary. Include a link to the full report for anyone who wants to drill in.
Frequency: Weekly, same Monday as the full report lands. Monthly rollup for the board deck.
Audience 3: Board and investors (monthly rollup, trend + benchmark)
Four-week trends, not single-week movements. Stage-appropriate benchmarks (from the pillar's benchmark table) to contextualize whether you're performing above, at, or below expectation. ROI summary with AI-referred pipeline contribution.
Format: 1-page slide or 1-paragraph narrative in the board deck. Never more.
Frequency: Monthly, aggregating the prior 4 weekly reports.
The common thread
All three framings share the same underlying data. The difference is what gets surfaced to each audience. Don't produce three separate reports — produce one full report and selectively excerpt for the other audiences. This keeps your effort on the measurement, not on the packaging.
Sample Weekly AI Visibility Report (Annotated)
Below is a redacted example of what a real weekly report looks like, with annotations explaining each section.
Weekly AI Visibility Report — Week of April 7-13, 2026
Headline Summary
BVS grew 3 points to 47, driven by Perplexity citation rate recovery after last week's content refresh batch. Share of voice closed the gap on Competitor A from 11 points to 8. Next week we're refreshing 5 Google AI Mode-weak pages and publishing one new Perplexity-targeted comparison piece.
[Annotation: This single paragraph is what leadership reads. "BVS grew," explains why, names the gap-closing, commits to specific next actions. Full context in under 60 words.]
Brand Visibility Score Movements
Week | BVS | Citation Rate | Brand Mention Rate | AI Share of Voice | LLM Conversion Rate |
|---|---|---|---|---|---|
Current | 47 | 22% | 38% | 21% | 12.3% |
Prior week | 44 | 19% | 36% | 20% | 11.8% |
4 weeks ago | 41 | 17% | 33% | 18% | 10.9% |
[Annotation: 4-week trend is the important signal. All four sub-metrics moved in the right direction over 4 weeks — this is what sustained improvement looks like.]
Citation Rate by Platform
Platform | This Week | Last Week | 4-Week Trend |
|---|---|---|---|
ChatGPT | 24% | 23% | ↑ +3 |
Perplexity | 31% | 26% | ↑ +7 |
Claude | 14% | 13% | → |
Google AI Mode | 18% | 18% | → |
[Annotation: Perplexity is pulling the composite up. Google AI Mode is flat despite optimization work — this becomes next week's priority.]
AI Share of Voice
Brand | Mention Share | Citation Share | Composite SOV | Gap to Leader |
|---|---|---|---|---|
Competitor A | 28% | 31% | 29% | — |
Your brand | 20% | 22% | 21% | 8 pts |
Competitor B | 18% | 16% | 17% | 12 pts |
Competitor C | 14% | 13% | 14% | 15 pts |
Competitor D | 10% | 11% | 10% | 19 pts |
[Annotation: You moved from #3 to #2 in the competitive set this week. Gap to Competitor A closed from 11 points to 8. The SOV story reinforces that absolute improvement is also producing relative gains — the ideal signal.]
Attribution and Traffic
Metric | This Week | Last Week | 4-Week Trend |
|---|---|---|---|
AI-referred sessions (GA4) | 412 | 356 | ↑ +15% |
AI-referred conversion rate | 13.1% | 12.8% | ↑ |
AI-inferred sessions (landing-page pattern) | 198 | 172 | ↑ +15% |
Total AI traffic (attributed + inferred) | 610 | 528 | ↑ +15% |
Top AI-referred pages this week: | |||
/blog/ai-citation-tracking | 78 sessions | 61 | ↑ |
/blog/brand-visibility-score | 64 sessions | 52 | ↑ |
/blog/seo-vs-geo | 51 sessions | 47 | ↑ |
/blog/prompt-library-methodology | 43 sessions | 31 | ↑ |
/how-to/track-ai-citations | 38 sessions | 35 | → |
[Annotation: The 15% week-over-week growth is meaningful. The fact that the growth is concentrated on recently-refreshed pages proves causation — refresh work is producing the traffic, not external trend.]
Editorial Priorities for Next Week
Refresh 5 Google AI Mode-weak pages (focus on schema markup upgrade + author signals; Google AI Mode citation rate is flat despite Perplexity gains, which indicates E-E-A-T gaps)
Publish new comparison piece targeting "Jasper vs [your brand]" — this query surfaced 12 times in our prompt runs this week with inconsistent brand mentions, indicating opportunity
Update Bing Webmaster Tools indexing on 3 pages that show in Perplexity but not ChatGPT (likely Bing indexing gap)
Investigate 6 Direct traffic landing pages where volume looks anomalous relative to organic ranking — likely hidden AI referrals from mobile app clicks with stripped attribution
[Annotation: The report ends here. 6 sections, ~600 words of content plus tables, every section answers a specific question. This is what a sustainable weekly deliverable looks like.]
From Report to Action: The Editorial Loop
The report's value is the editorial decisions it drives. Here's the loop.
Monday morning: Produce the report
90-minute time budget. 6 sections. Distribute to team and leadership.
Monday afternoon: Editorial standup
The content team meets for 30 minutes. Reviews the report's Section 6 priorities. Assigns specific work to specific people with specific deadlines. Example:
"Sarah, refresh the 5 Google AI Mode-weak pages this week"
"Tom, draft the Jasper comparison piece for Friday publish"
"Marco, fix the Bing indexing gaps by Tuesday"
Tuesday-Friday: Production
Work flows against the Monday priorities. No second-guessing the report's decisions. Execute what was committed.
Following Monday: Next report
New data shows whether the prior week's work produced measurable impact. If Sarah's Google AI Mode refreshes moved that platform's citation rate from 18% to 21%, that's direct signal her work is paying off. If citation rate stayed flat, revisit tactics.
The compounding effect
After 8-12 weeks of this loop, three things happen:
Editorial priorities become data-driven. No more "what should we write about this week?" conversations — the report produces the answer.
Content production concentrates on highest-impact work. The top-performing tactics (refreshes, schema, answer capsules) become default production patterns because the data keeps proving them out.
Leadership confidence compounds. 8-12 weeks of weekly reports showing citation rate climbing, SOV gaining ground, and AI-referred traffic growing 10-15% per month transforms AI visibility from "experiment" to "core channel" in executive mental models.
This loop is the whole point of the measurement work.
Common Weekly Reporting Mistakes
Mistake 1: Changing the report structure every week
Teams iterate the template constantly. Each week's report looks slightly different. Readers can't compare week-over-week because the format shifts. Fix: lock the structure for at least 90 days before considering changes.
Mistake 2: Burying the headline
Reports that start with data tables and end with summary. Leadership stops reading before the summary. Fix: headline narrative first, always. If someone only reads the first paragraph, they should have the full story.
Mistake 3: Over-investigating weekly movements
Spending 30 minutes trying to explain a 3-point citation rate shift that's just sampling noise. Fix: trust the cadence. Weekly shifts within 4-5 points are noise. Investigate trends across 4+ weeks, not individual weeks.
Mistake 4: No editorial priorities section
Reports that end with data and no decisions. Measurement without action. Fix: Section 6 is mandatory. Every report ends with 3-5 specific, assigned actions for the coming week.
Mistake 5: Same format for all audiences
Sending the full 6-section report to the CMO and the board. They don't read it. Fix: three framings (team, leadership, board) from the same underlying report. Adjust packaging, not the underlying work.
Mistake 6: Manual report building forever
Teams maintain the spreadsheet → document workflow at 10+ months, consuming 6+ hours weekly. Fix: once the report structure is locked and proven, move to automated pipeline that assembles the report from raw measurement inputs. Reserve operator time for the narrative and editorial decisions, not the mechanical assembly.
Content Engine Integration
Manual weekly reporting at 90 minutes is the right starting point. The discipline of manually assembling the report teaches you what matters, what doesn't, and how the metrics interact. After 8-12 weeks, most teams have internalized the structure and the mechanical assembly becomes unnecessary overhead.
A content engine automates the assembly layer:
Prompt library runs automatically across all 4 platforms on the weekly schedule
Citation, mention, and SOV data feed into the report template without manual logging
GA4 attribution data pulls into Section 5 without building custom segments weekly
Trend analysis (4-week rolling averages, gap-to-leader calculations) computes automatically
Editorial priorities flagged based on data patterns the engine surfaces (declining citation rate on specific platforms, widening competitive gaps, new opportunity queries)
Three audience framings generate from one report source (full team version, leadership summary, board rollup)
The human work that remains: reviewing the report, adjusting the editorial priorities based on strategic context, presenting to leadership. The 90-minute weekly ritual becomes a 20-minute review.
For teams at 20+ employees running full AI visibility programs, the automation is worth it.
For teams under 20 doing manual measurement, the discipline of the weekly ritual is more valuable than the time savings — do the manual work until the muscle memory is there, then automate.
FAQs
What is a weekly AI visibility report?
A weekly AI visibility report is a fixed-structure deliverable that consolidates Brand Visibility Score, citation frequency across platforms, AI share of voice, and AI-referred traffic metrics into one document produced every Monday. It's the operational artifact that turns scattered measurement work into editorial decisions, leadership updates, and defensible ROI. Without the report, AI visibility data sits in spreadsheets that nobody reads. With it, AI visibility becomes a weekly decision-making rhythm driving content production.
How long should the weekly report take to produce?
90 minutes is the sustainable cadence: 45 minutes running the prompt library across ChatGPT, Perplexity, Claude, and Google AI Mode; 20 minutes logging citations and calculating metrics; 10 minutes writing narrative; 15 minutes distributing and responding to questions. If the process consistently takes over 2 hours, the root cause is usually an oversized prompt library (above 40 prompts) rather than operator speed. Shrink the library before extending the time budget.
Why weekly and not daily or monthly?
Daily reporting is too noisy — AI engine responses vary meaningfully day-to-day and a daily cadence captures sampling variation as trend. Monthly reporting misses optimization feedback loops: Perplexity citation changes show up in 2-4 weeks, so monthly catches changes after they've already happened. Weekly matches typical content production cadence (1-4 pieces per week) and produces the right signal-to-noise ratio for trend detection.
What goes in the report?
Six required sections: (1) headline summary — one-paragraph narrative of what happened and what's next; (2) Brand Visibility Score movements with 4-week trend context; (3) citation rate broken down by platform; (4) AI share of voice vs. defined competitive set; (5) AI-referred traffic and attribution including top landing pages; (6) 3-5 editorial priorities for the coming week. Every section answers a specific question. Missing sections break the report's purpose.
Who should the report go to?
Three audiences with three framings from the same underlying data. The content team gets the full 6-section report (tactical, 2-3 pages). CMO and leadership get the headline summary plus attribution/traffic data (summary, 4-5 sentences plus a link). Board and investors get monthly rollups with 4-week trends and stage-appropriate benchmarks (1 paragraph or 1 slide). Produce one report, excerpt for the other audiences rather than building three separate reports.
What's the difference between the weekly report and a dashboard?
A dashboard displays live data continuously. A report tells a story at a point in time. Dashboards work for operational monitoring — you glance at them throughout the week to catch anomalies. Reports work for decision-making — the weekly narrative forces synthesis and produces editorial commitments. Most AI visibility programs need both: a live dashboard for spot-checking and a weekly report for deliberate decisions. The report drives production, the dashboard catches surprises between reports.
When should I automate report generation?
After 8-12 weeks of manual reporting. Manual assembly teaches you what the metrics mean and how they interact — knowledge that automation can't produce. Once the structure is locked, the editorial loop is running, and the team has internalized what "normal" movements look like, automation becomes pure time savings rather than a shortcut around understanding. Automating too early means the team treats the report as a black box rather than an instrument they can interpret.
Related Resources
Core AI Visibility Framework
The Complete Guide to AI Visibility for B2B SaaS — the pillar this piece sits under
Brand Visibility Score: The Only AI Search Metric That Actually Matters
AI Citation Tracking: How to Measure Citation Frequency Across ChatGPT, Perplexity, and Claude
AI Share of Voice: The Competitive Metric Most SaaS Teams Aren't Tracking Yet
Measurement Inputs
Attribution for AI-Referred Traffic: Fixing the "Direct Traffic" Problem in GA4
How to Build an AI Visibility Prompt Library (25-50 Prompts That Actually Matter)
SEO Visibility vs. AI Visibility: The Two Metrics Every B2B SaaS Needs in 2026
Analytics & Reporting Context
ChatGPT vs. Perplexity vs. Google AI Mode: The B2B SaaS Citation Benchmarks
The Top 5 Marketing Metrics Every Startup Should Track in 2026
How to Measure Marketing Success: The Most Important KPIs and Metrics
Editorial Production Integration
The GEO Playbook 2026: Getting Cited by LLMs, Not Just Ranked by Google
Building Citation-Worthy Content: Making Your Brand a Data Source for LLMs