TL;DR
🎯 AI visibility is the measurement of how often your brand appears in AI-generated answers across ChatGPT, Perplexity, Claude, and Google AI Mode. It replaces rankings and clicks as the primary indicator of content performance in 2026.
📉 Traditional metrics broke because the buyer journey moved inside AI answers. Impressions inflated, CTR collapsed 61% on AI Overview queries, direct traffic ballooned with stripped attribution, and rankings stopped correlating with revenue.
🏗️ Five metrics drive AI visibility: Brand Visibility Score (composite), citation frequency, brand mention rate, AI share of voice, and LLM conversion rate. Startups that target all five outperform those optimizing for any single metric.
⚡ Platform fragmentation is real. Only 11% of sites are cited by both ChatGPT and Perplexity simultaneously. Each engine requires platform-specific optimization — treating them as one target guarantees mediocre results across all four.
🛠️ 90-minute weekly measurement is achievable with free tools. A 25-50 prompt library + ChatGPT + Perplexity + Google AI Mode + a spreadsheet = weekly AI visibility tracking without $500-$2,000/month enterprise platforms.
📊 Realistic benchmarks: seed-stage 2-8% citation rate, Series A 8-20%, Series B+ 20-35%, category leaders 35-50%. The trend matters more than the absolute number — is your BVS climbing?

Zach Chmael
CMO, Averi
"We built Averi around the exact workflow we've used to scale our web traffic over 6000% in the last 6 months."
Your content should be working harder.
Averi's content engine builds Google entity authority, drives AI citations, and scales your visibility so you can get more customers.
The Complete Guide to AI Visibility for B2B SaaS: How to Get Found (and Stay Found) Inside AI Answers in 2026
Ask your CMO one question: when a buyer opens ChatGPT and asks about our category, does our brand show up in the answer?
Most can't answer.
Their dashboards measure impressions, clicks, rankings, organic sessions. None of those tell you whether an AI engine mentioned your brand when the decision was being made.
60% of Google searches now end without a click.
Gartner projects 25% of total search volume will shift to AI interfaces by the end of 2026.
AI-referred traffic to the top 1,000 websites grew 357% year-over-year, reaching 1.13 billion visits in June 2025.
ChatGPT serves 800 million users weekly. AI-referred visitors convert at 14.2% compared to Google's 2.8%.
Yet only 18% of brands have an active AI visibility strategy. The other 82% are invisible by default — and they don't know it because the metrics they report on don't measure it.
This is the problem AI visibility solves.
It's the discipline of measuring, tracking, and improving how often your brand appears inside AI-generated answers across ChatGPT, Perplexity, Claude, and Google AI Mode.
Not "do we rank well on Google." Not "how much organic traffic did we get."
A different question entirely: when a buyer asks an AI about our category, are we in the answer?
This pillar is the complete framework.
What AI visibility actually measures. The five metrics that matter. Platform-specific optimization (because the engines disagree). The 90-day program to go from 0% to ~20% citation rate. Benchmarks by stage. The tools and templates needed to run it weekly at a startup with $0 enterprise tooling budget. And the common mistakes that make teams think AI visibility is working when it isn't.
Every link in this guide goes deeper into a specific tactic. Treat this as the map; follow the links for the tactical playbooks.
See what your Content ROI could be with a GEO optimized content engine
What Is AI Visibility?
AI visibility is the measurement of whether and how prominently your brand appears inside AI-generated answers.
It includes citation frequency (how often you're cited as a source), brand mention rate (how often your brand is named), placement (headline vs. body vs. footnote), sentiment (positive, neutral, or negative), and AI share of voice (your mentions relative to competitors).
Together these signals tell you whether AI engines treat your brand as a trusted source when buyers ask about your category.
The distinction that matters: ranking is about where you appear on a page of search results.
AI visibility is about whether you appear inside a synthesized answer before the user ever sees a page of results. Different mechanic, different measurement.
Every piece of content your team produces either earns AI visibility or doesn't. Every refresh either improves it or leaves it flat. Every new page either compounds your citation authority or sits unread by the engines that matter most.
The field emerged in 2023-2024 as AI search engines started replacing traditional search for category research queries. By 2026, 76% of B2B buyers now use AI tools in their research process. Gartner projects 60% of brands will use agentic AI to deliver streamlined 1:1 interactions by 2028.
For B2B SaaS specifically, this is the most important measurement shift in a decade.
Your buyer is no longer clicking through 10 blue links to research your category. They're asking Claude, Perplexity, or ChatGPT — and the AI is pre-qualifying which brands they'll consider before you ever see a website visit.
Why Traditional Metrics Are Breaking (And What to Track Instead)
Traditional SEO metrics broke because the buyer journey moved inside AI answers. Impressions inflated as AI Overviews trigger on more queries. CTR collapsed from 1.76% to 0.61% on AI Overview searches.
Direct traffic ballooned because AI-referred sessions strip referrer data. Rankings became uncorrelated with revenue because buyers get answers without clicking.
None of your existing dashboards show the part of the buyer journey that matters most.
Each of these shifts has a specific cause. Understanding the mechanics helps explain why measuring the new way isn't optional.
Impressions inflated. AI Overviews now appear on 60%+ of informational searches. Every Overview generates an impression for cited sources, but the user often never clicks. Your impressions go up while your clicks go down — the CTR ratio looks like a disaster when you're actually being exposed to more relevant searches.
CTR collapsed because zero-click is now default. Seer Interactive's analysis of 25 million impressions showed organic CTR dropped 61% on AI Overview queries between June 2024 and September 2025. The user reads the AI's synthesized answer and scrolls past your blue link entirely.
Direct traffic ballooned because AI referrals strip attribution. Forrester estimates AI-generated traffic is 2-6% of total organic traffic and growing 40%+ per month. Most of it shows up as "Direct" in GA4 because ChatGPT, Perplexity, and Claude don't pass referrer data the way Google does. Your direct traffic isn't actually direct — it's AI-referred traffic with no UTM parameters, and it's growing faster than anything else in your dashboard.
Rankings stopped correlating with revenue. A buyer asks ChatGPT "what's the best content engine for startups." If your brand appears in the answer, they research you next. They might never click your blog post. They might go straight to your homepage two days later as "direct" traffic. You ranked nowhere for the original query and you got the customer anyway.
The practical implication: if your dashboard still leads with "organic sessions grew 12% this month," you're measuring a decreasing share of buyer behavior with worsening attribution accuracy. Add AI visibility metrics to your primary reporting or accept that your metrics are slowly becoming fiction.
For a full side-by-side breakdown of when to use traditional SEO metrics versus AI visibility metrics, see SEO Visibility vs. AI Visibility: The Two Metrics Every B2B SaaS Needs in 2026.

The 5 Pillars of AI Visibility
AI visibility is a composite discipline, not a single number.
Five component metrics work together to give you a complete picture of how AI engines treat your brand. Track all five and you have the honest view most dashboards miss.
Pillar | What It Measures | Track It |
|---|---|---|
1. Brand Visibility Score (BVS) | Composite metric combining citation frequency, placement, link presence, and sentiment | Weekly |
2. Citation frequency | How often AI engines cite your content as a source | Weekly |
3. Brand mention rate | How often AI engines name your brand (with or without citation link) | Weekly |
4. AI share of voice | Your mentions/citations relative to competitors in the same category | Monthly |
5. LLM conversion rate | Conversion rate of AI-referred traffic vs. other channels | Monthly |
Pillar 1: Brand Visibility Score
Brand Visibility Score is the composite headline metric. It combines citation frequency, placement (headline vs. body vs. footnote), link presence, and sentiment across AI engines into a single 0-100 score you can track week over week. BVS is the primary indicator that captures whether AI buyers ever encounter your brand — other metrics are diagnostic components that help you understand why the composite score is moving.
If you track only one AI visibility metric, track BVS. Everything else is context for understanding it.
Pillar 2: Citation Frequency
Citation frequency is the percentage of buyer-relevant prompts where AI engines cite your content as a source (typically with a clickable link). This is the clearest signal of AI search authority. When citation frequency rises, AI platforms are treating your brand as a trusted source on that topic.
SaaS companies should target 20-30% citation rate across their tracked prompt set as the threshold of meaningful AI visibility. Below 10% means you're invisible. Above 40% is exceptional and usually requires sustained category leadership.
Pillar 3: Brand Mention Rate
Brand mention rate tracks how often AI engines name your brand by name, with or without a citation link. AI mentions influence buyers without generating a click — an AI saying "tools like [your brand] help marketers do X" shapes consideration even when no link appears.
Target benchmark: brand mention rate should run 1.5-2x your citation frequency. If you're cited 20% of the time but only mentioned 22%, your citations aren't producing the awareness lift they should be.
Pillar 4: AI Share of Voice
AI share of voice is your brand's mention share relative to direct competitors. If a buyer asks about your category and ChatGPT mentions 5 brands in the answer, you want to be in 3 of those mentions, not 0.
Target benchmark: 25-40% share of voice within your defined competitive set. Below 15% means competitors are owning the category in AI search. Above 50% indicates dominant category positioning.
Pillar 5: LLM Conversion Rate
LLM conversion rate is the conversion rate of AI-referred traffic relative to other channels. This is where the ROI lives. AI-referred visitors convert at approximately 14.2% versus Google's 2.8% — the highest-intent traffic most startups have ever seen.
Target benchmark: AI-referred traffic should convert at 5-10x the rate of paid social and 3-5x the rate of organic Google. If your AI-referred conversion rate is below 5%, your landing experience isn't matching the pre-qualified intent of the visitor.
Platform-Specific Visibility: Why One Strategy Fails
The biggest mistake in AI visibility work is treating ChatGPT, Perplexity, Claude, and Google AI Mode as a single target. They disagree dramatically about which sources to cite.
Only 11% of sites are cited by both ChatGPT and Perplexity simultaneously. Each platform runs its own retrieval logic, its own index, its own ranking algorithm. A site dominating Perplexity can be invisible on ChatGPT, and vice versa.
Platform | Index Source | Freshness Weight | Citation Rate | Best-Fit Content |
|---|---|---|---|---|
ChatGPT | Bing index + live web | Moderate | 87% of responses cite sources | In-depth, authoritative, structured |
Perplexity | Proprietary index + live web | Very high | 3-4 sources per query, high citation | Fresh, fact-dense, expert-led |
Claude | Less public detail, structured retrieval | Moderate | Moderate citation, precision-focused | Technical, analytical, carefully sourced |
Google AI Mode | Google index + knowledge graph | High | 76% of responses cite sources | E-E-A-T signals, schema, entity density |
The practical implications:
ChatGPT rewards Bing index strength. If your site isn't indexed by Bing, ChatGPT can't cite it. Start with Bing Webmaster Tools setup before anything else.
Perplexity rewards freshness. Content updated in the past 12 months earns 3.2x more citations on Perplexity specifically. If you only have budget to optimize for one platform and you want fast feedback loops, start with Perplexity. Changes show up in 2-4 weeks.
Claude rewards precision and structure. Technical content with clear sourcing, defined terms, and logical argument tends to earn Claude citations at higher rates than flashy or promotional content.
Google AI Mode weights E-E-A-T heavily. 96% of AI Overview citations come from sources with strong E-E-A-T signals. Author bios, schema markup, citation diversity, and brand authority matter more here than elsewhere.
Platform-specific strategy isn't a nice-to-have.
It's the difference between "we're cited everywhere" and "we're cited by Perplexity but invisible to ChatGPT." Which is what most companies actually experience once they start measuring.
Want to check your GEO readiness?
The AI Visibility Measurement Stack
Enterprise visibility platforms (Otterly, Profound, Semrush AI Visibility Toolkit, LLM Pulse, Visiblie) run $500-$2,000/month. Useful at scale, excessive at startup stage.
A 20-person startup can produce weekly AI visibility reports using free tools + 90 minutes of operator time. Here's the stack.
Free stack (startup default)
Prompt library: Google Sheet with 25-50 buyer-relevant queries (template methodology)
Platform access: ChatGPT (with web search enabled), Perplexity, Google AI Mode, Claude
Data logging: Spreadsheet tracking citations, mentions, placement, sentiment per platform
Traffic attribution: Google Analytics 4 with AI-referrer segment + Fathom Analytics for cleaner tracking
Conversion analytics: Whatever your product already uses (Amplitude, Mixpanel, Heap)
Total cost: $0-$25/month depending on your analytics choice.
Paid stack (Series B+)
Automated citation tracking: Otterly or Profound ($99-$499/month) for passive monitoring
Competitive benchmarking: Semrush AI Visibility or LLM Pulse ($199-$499/month)
Enterprise monitoring: Visiblie or similar ($500-$2,000/month) for multi-brand orchestration
The paid stack is worth it once you're tracking 100+ prompts across 5+ engines and need automated alerts when competitive share of voice shifts. Before that scale, the manual approach produces the same strategic insight at 1/20th the cost.
Attribution layer
Every AI visibility stack needs an attribution layer that connects AI citations to pipeline. The GA4 "Direct" traffic problem means most AI-referred sessions get misclassified as direct. Fixing this requires custom segmentation, referrer cleanup, and in many cases moving conversion tracking to a tool that handles AI referrers natively.
For the full tactical breakdown including GSC integration, GA4 custom segments, and ChatGPT-specific referrer handling, see How to Track AI Citations and Measure GEO Success.
The 90-Day AI Visibility Program
Going from zero to a functional AI visibility program takes 90 days. Not because the work is hard — because the feedback loops have built-in delays (Perplexity updates in 2-4 weeks, ChatGPT in 6-12 weeks). Here's the sequence.
Days 1-14: Setup
Build your prompt library (25-50 category, comparison, and use-case queries)
Set up baseline tracking: run every prompt across ChatGPT, Perplexity, and Google AI Mode once
Log current citation rate, brand mention rate, and AI share of voice
Configure GA4 with AI-referrer segments (chatgpt.com, perplexity.ai, claude.ai, bing.com, gemini.google.com)
Identify your 10 highest-impression existing pages in Google Search Console
This gives you a starting baseline to measure improvement against.
Days 15-45: Content optimization sprint
Apply the Answer Capsule Playbook to your 10 highest-impression pages (40-60 word answer capsules under every H2)
Refresh dates, statistics, and sources on each page (content updated in past 12 months earns 3.2x more citations)
Add FAQ schema, Article schema, and Author schema markup
Increase fact density to at least 1 cited fact per 80 words of body content
Request re-indexing for each refreshed URL in Google Search Console and Bing Webmaster Tools
10 pages × roughly 60-90 minutes per page = 10-15 hours of focused work across three weeks.
Days 46-75: Measurement and iteration
Run your prompt library weekly. Log changes in citation rate, mentions, and AI share of voice
By week 6, Perplexity and Google AI Mode citation rates should show measurable changes
Identify which optimizations moved the needle (usually answer capsules + freshness first)
Double down on working patterns; adjust pages that didn't move
Days 76-90: Scale and systematize
Extend optimization to the next 10 striking-distance pages
Build your Weekly AI Visibility Report template so the measurement becomes repeatable
Set up a content production workflow that bakes AI visibility standards into new content (answer capsules, fact density, schema, freshness) so you don't build debt
Establish a monthly review cadence for AI share of voice vs. competitors
By day 90, you have: a functioning measurement system, 10-20 optimized pages, baseline benchmarks, and early signal about what's working. Most startups see 15-30% citation rate lift on refreshed pages within the first 60 days.

Realistic Benchmarks by Stage
Most founders ask "what's a good citation rate?" without context. The honest answer depends on your stage, domain authority, and competitive density.
Stage | Citation Frequency | Brand Mention Rate | AI Share of Voice | LLM Conversion Rate |
|---|---|---|---|---|
Pre-seed (0-3 months content) | 0-2% | 0-5% | 0-3% | N/A — no traffic yet |
Seed (3-12 months content) | 2-8% | 5-15% | 3-10% | 5-10% |
Series A (12-36 months content) | 8-20% | 15-30% | 10-25% | 8-15% |
Series B+ (3+ years content) | 20-35% | 30-50% | 25-40% | 10-18% |
Category leader | 35-50% | 50-70% | 40-60% | 12-20% |
The pattern across hundreds of B2B SaaS companies tracking AI visibility in 2026: the gap between "Series A startup" and "category leader" is typically 18-24 months of consistent content investment, not a tooling or technical difference.
Three things compound faster than expected:
Answer capsule retrofits to existing high-impression pages (weeks to impact)
Platform-specific freshness on Perplexity (2-4 weeks)
Source diversity across G2, Capterra, Reddit, industry publications (brands cited across 4+ domain types see 78% more citation consistency)
Three things don't compound as fast as people think:
Domain authority improvements (6-12 months to show AI visibility impact)
Brand-new content (6-12 months minimum to reach citation threshold)
Cross-platform uniformity (often 12+ months to narrow the ChatGPT/Perplexity gap)
The trend matters more than the absolute number.
A seed-stage startup growing from 3% to 9% citation rate in a quarter is winning.
A category leader stuck flat at 35% is losing ground relative to competitors who are still climbing.
The Five Most Common AI Visibility Mistakes
Five failure patterns we see repeatedly when auditing AI visibility programs.
Mistake 1: Treating all AI engines as one target
Teams run a single "AI optimization" playbook and apply it uniformly to ChatGPT, Perplexity, Claude, and Google AI Mode. Results are mediocre across all four because each engine weights different signals.
Fix: Build platform-specific tactics into your prompt library tracking and content optimization. If you only have resources to optimize for one, start with Perplexity (fastest feedback loop).
Mistake 2: Optimizing without measuring
Teams read a GEO guide, apply structural changes, and assume it's working. Six months later, they can't demonstrate whether any of it moved citation rate.
Fix: Baseline measurement happens before optimization. If you don't know your starting citation rate, you can't prove improvement. Run your prompt library once before touching any content.
Mistake 3: Ignoring the attribution problem
AI-referred traffic shows up as "Direct" in GA4. Teams miss 30-50% of AI-driven pipeline because they never fix the attribution layer and assume direct traffic means brand search.
Fix: Build AI-referrer segments in GA4 on day one. Track AI-referred traffic separately from direct traffic. Don't let unfixed attribution hide your most valuable traffic source.
Mistake 4: Reporting without taking action
Weekly AI visibility reports get circulated, skimmed, and filed. No one pulls action items from them. The measurement system exists but doesn't change content production.
Fix: Every weekly report should answer one question: "What content do we refresh or produce next based on this data?" If the report doesn't drive an editorial decision, it's overhead.
Mistake 5: Giving up after 4 weeks
AI visibility has lagged feedback loops. Perplexity updates in 2-4 weeks, Google AI Mode in 2-4 weeks, ChatGPT in 6-12 weeks. Teams check citation rate at week 3, see minimal change, and conclude GEO doesn't work.
Fix: Commit to a full 90-day measurement cycle before evaluating whether your AI visibility program is working. Changes below that time horizon are noise.
How a Content Engine Builds AI Visibility Into Production
Manually running an AI visibility program is feasible but time-intensive. Weekly measurement + monthly optimization + quarterly strategy review eats roughly 6-10 hours per week of focused content operations work.
For a 2-person startup, that's untenable alongside actual content production.
A content engine bakes AI visibility standards into the production workflow rather than treating them as a post-production audit:
Answer capsules generated automatically under every H2 during drafting
Fact density measured and flagged if below 1:80 threshold before publishing
Schema markup included in every published piece by default
GSC and GA integration surface striking-distance pages and AI-referred traffic natively
Weekly AI visibility reports generated from the tracked prompt library and analytics data
Platform-specific optimization (Perplexity freshness, ChatGPT Bing-index signals, Google AI Mode E-E-A-T) handled by the scoring system
The engine doesn't replace judgment. You still decide which topics matter, which angles to take, and which competitive narratives to write.
It handles the mechanical work — the structural standards, the scoring, the schema, the freshness cycles — so the weekly AI visibility program takes 90 minutes instead of 9 hours.
For startups running organic as their primary growth channel, this is the difference between treating AI visibility as a project and treating it as a system.
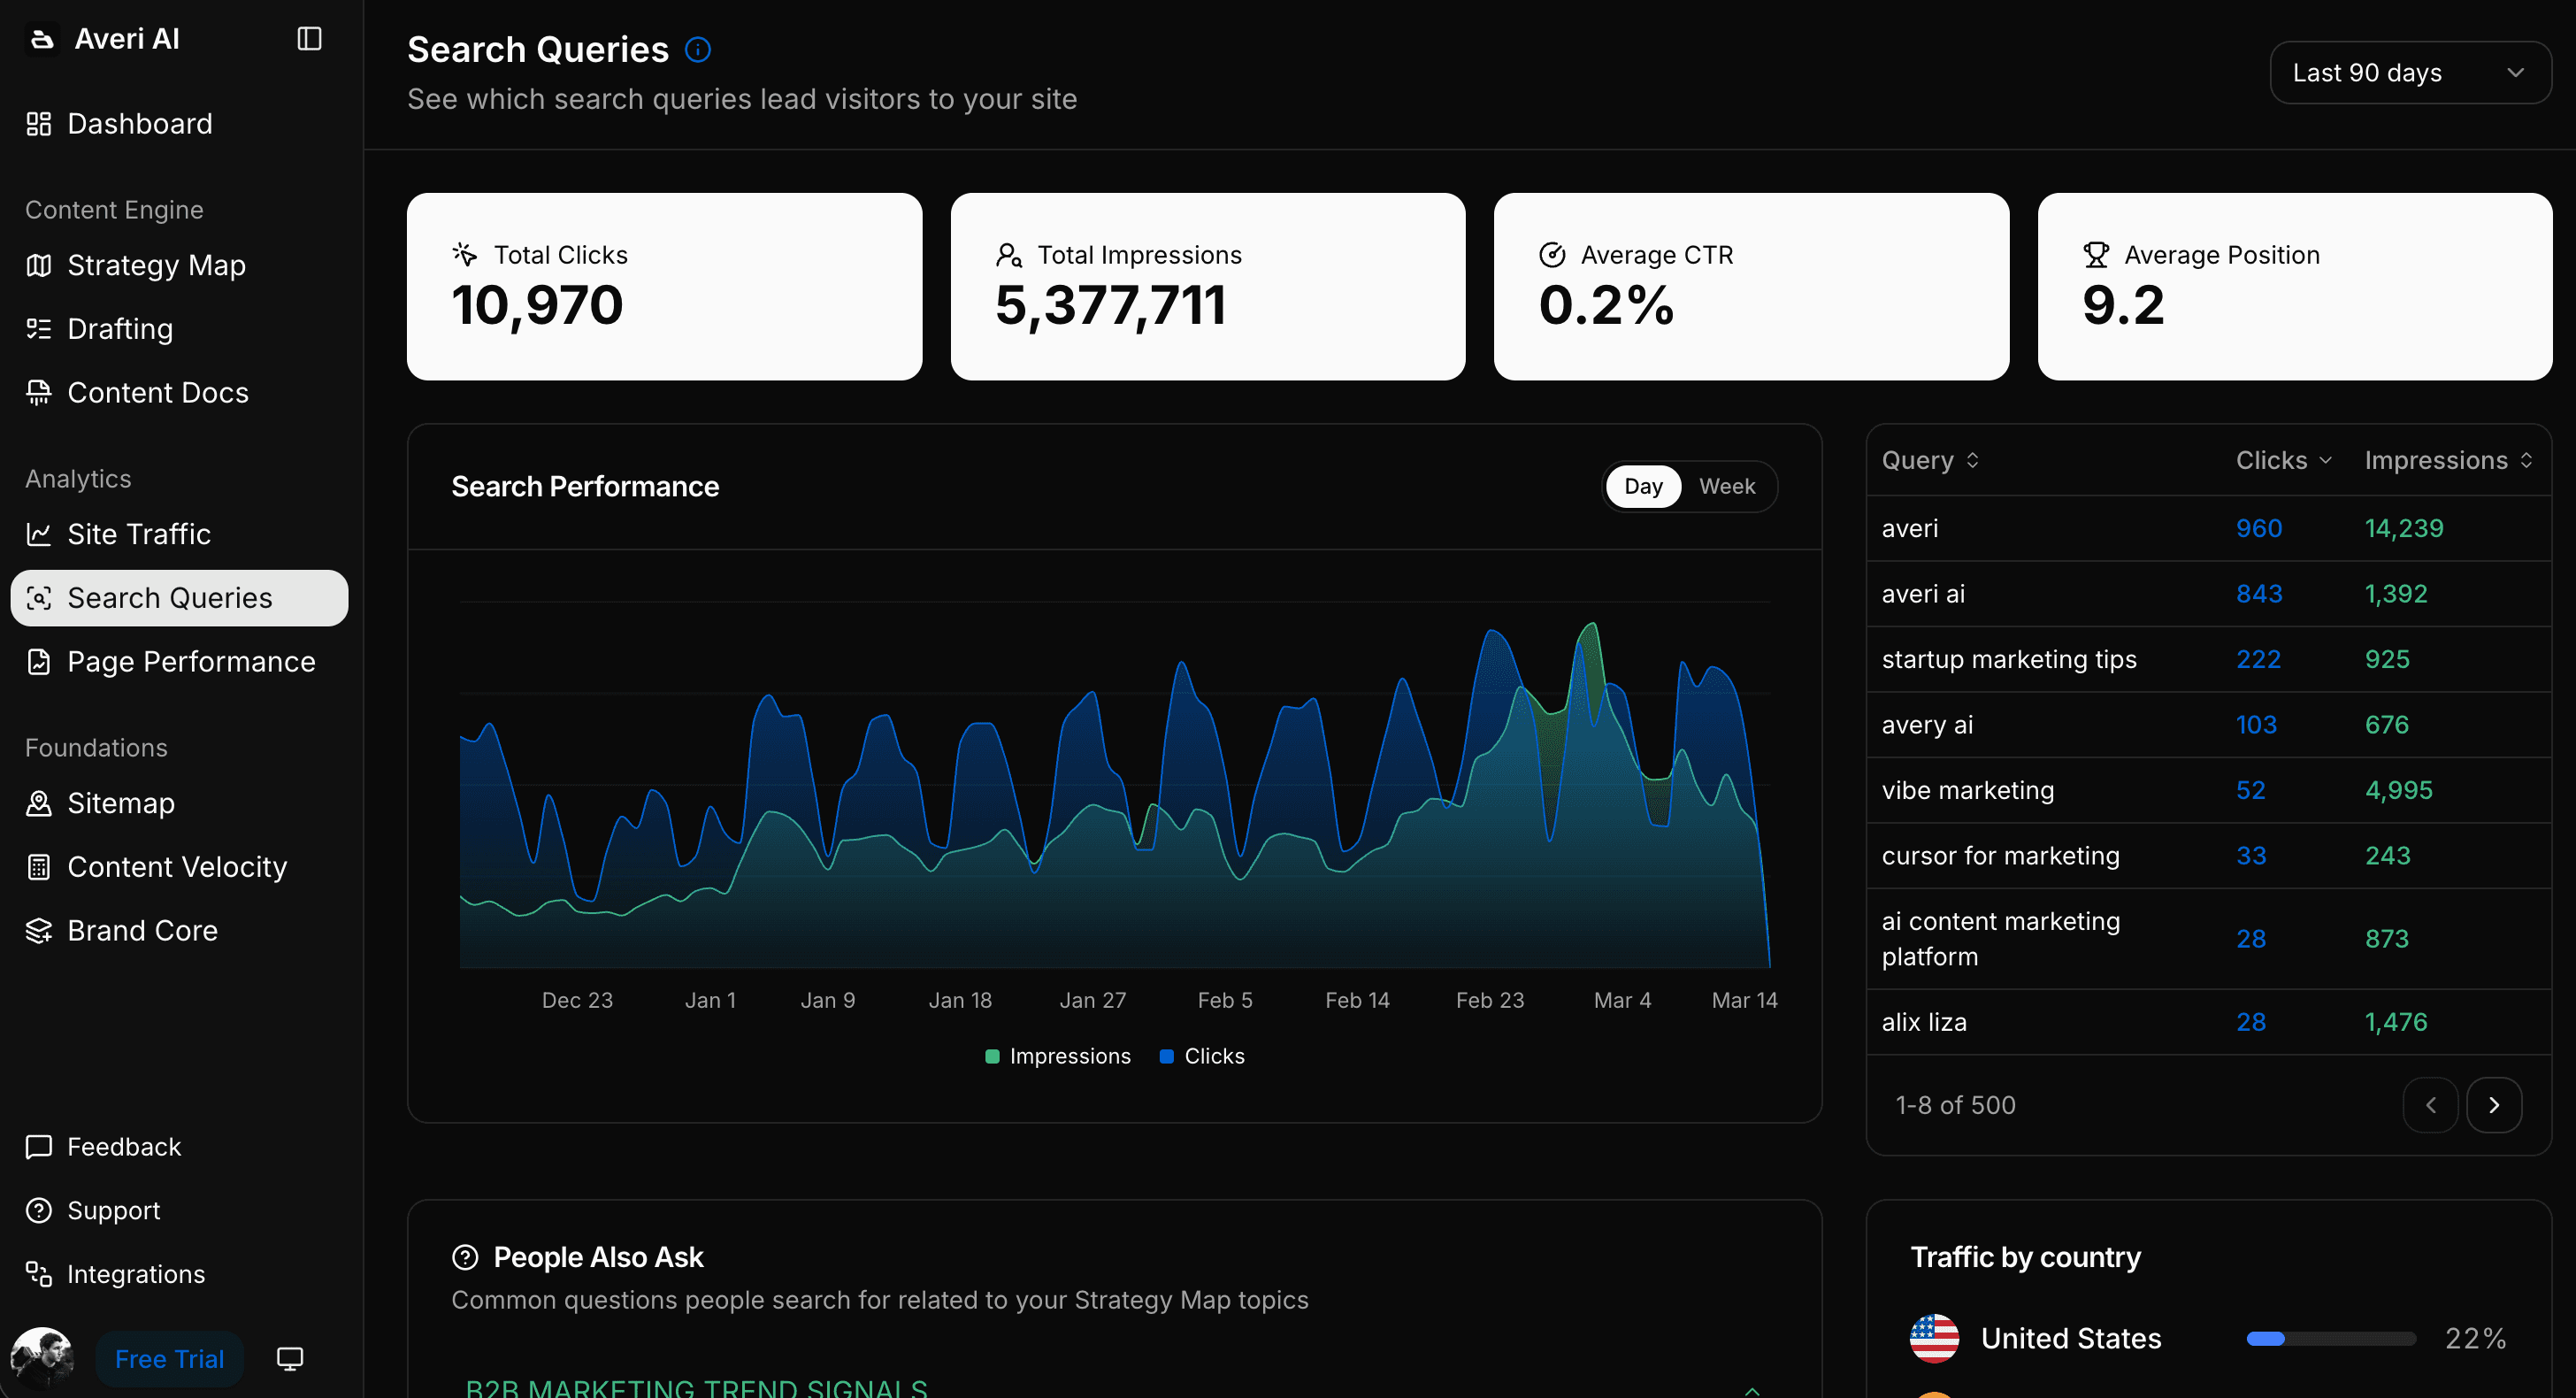
Averi's Analytics Dashboard surfaces the exact data you need: striking-distance pages ranked by opportunity score, citation tracking across platforms, and AI-referred conversion rate by source.
FAQs
What is AI visibility?
AI visibility is the measurement of how often and how prominently your brand appears inside AI-generated answers from engines like ChatGPT, Perplexity, Claude, and Google AI Mode. It combines citation frequency, brand mention rate, placement, sentiment, and AI share of voice into an overall picture of whether AI engines treat your brand as a trusted source. AI visibility replaces rankings and clicks as the primary indicator of content performance in an AI-mediated buyer journey.
How is AI visibility different from SEO?
SEO optimizes content to rank in traditional search results and drive clicks. AI visibility optimizes content to be extracted and cited by AI engines when they generate direct answers. Both share foundational principles (quality content, E-E-A-T, strong structure), but AI visibility requires every section to be independently extractable and every key claim to be citable out of context. The full side-by-side breakdown is in SEO Visibility vs. AI Visibility.
What's a good AI visibility score for a B2B SaaS startup?
Stage-dependent. Pre-seed companies typically score 0-5% citation frequency. Seed-stage companies with 3-12 months of consistent content see 2-8%. Series A companies hit 8-20%. Category leaders run 35-50%. The bigger signal than absolute score is trend direction — a startup growing from 5% to 12% in a quarter is winning. A flat or declining trend in an otherwise-mature content program is the warning sign.
How do I measure AI visibility without paying for an enterprise tool?
Build a 25-50 prompt library covering category, comparison, and use-case queries. Run them weekly across ChatGPT, Perplexity, and Google AI Mode. Log citations, mentions, placement, and sentiment in a spreadsheet. Calculate the four Brand Visibility Score components and a composite. The full process takes 60-90 minutes weekly using free tools. Enterprise platforms ($500-$2,000/month) automate this but aren't required at startup stage.
Why do AI engines cite different sources for the same query?
Each AI engine runs its own retrieval system, index, and ranking algorithm. ChatGPT relies on Bing's index, Perplexity uses a proprietary crawler with heavy freshness weighting, Claude uses structured precision retrieval, and Google AI Mode uses Google's index with E-E-A-T signals. Only 11% of sites are cited by both ChatGPT and Perplexity simultaneously — platform-specific optimization is necessary to avoid being invisible on engines that don't match your current structural signals.
How long does it take to see AI visibility improvement?
Platform-dependent. Perplexity and Google AI Mode typically show measurable citation changes in 2-4 weeks because both use live or frequently-refreshed indexes. ChatGPT takes 6-12 weeks due to Bing-index dependency. Most startups see 15-30% citation rate lift on refreshed pages within the first 60 days of implementing answer capsules and freshness cycles. Full program maturity (stable rankings, predictable citation patterns) takes 6-9 months.
Should I still track traditional SEO metrics?
Yes, but as supporting metrics rather than headline KPIs. Impressions, clicks, and rankings still measure the 75% of search volume that hasn't shifted to AI yet. Make AI visibility your primary reporting metric for the AI-influenced portion of the buyer journey while continuing to track impressions and clicks as supporting indicators. The mistake is leading with rankings when the buyer journey has moved to AI answers.
Related Resources
Core AI Visibility Metrics
Brand Visibility Score: The Only AI Search Metric That Actually Matters
AI Citation Tracking: How to Measure Citation Frequency Across ChatGPT, Perplexity, and Claude
AI Share of Voice: The Competitive Metric Most SaaS Teams Aren't Tracking Yet
Measurement & Attribution
Attribution for AI-Referred Traffic: Fixing the "Direct Traffic" Problem in GA4
How to Build an AI Visibility Prompt Library (25-50 Prompts That Actually Matter)
The Weekly AI Visibility Report: A 90-Minute Template for Startup Teams
Strategic Context
SEO Visibility vs. AI Visibility: The Two Metrics Every B2B SaaS Needs in 2026
ChatGPT vs. Perplexity vs. Google AI Mode: The B2B SaaS Citation Benchmarks
GEO Tactical Playbooks
The GEO Playbook 2026: Getting Cited by LLMs, Not Just Ranked by Google
Building Citation-Worthy Content: Making Your Brand a Data Source for LLMs
Schema Markup for AI Citations: The Technical Implementation Guide